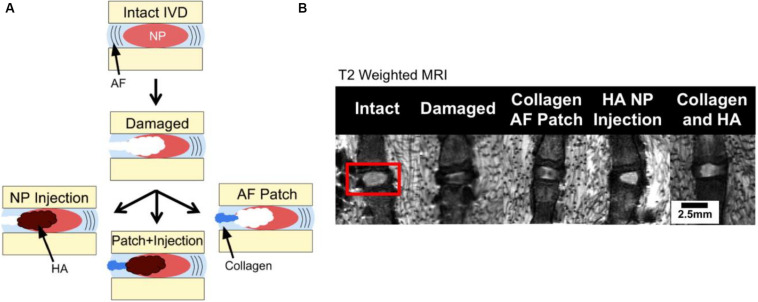
FIGURE 4.
(A) Segments test via annulotomy/nucleotomy and (B) MRI images of NP hydration and morphology where hyperintense regions correspond with greater relaxation time and hydration. Reproduced from Sloan et al. (2017) with permission from Copyright 2017 Elsevier.

