Fig. 1.
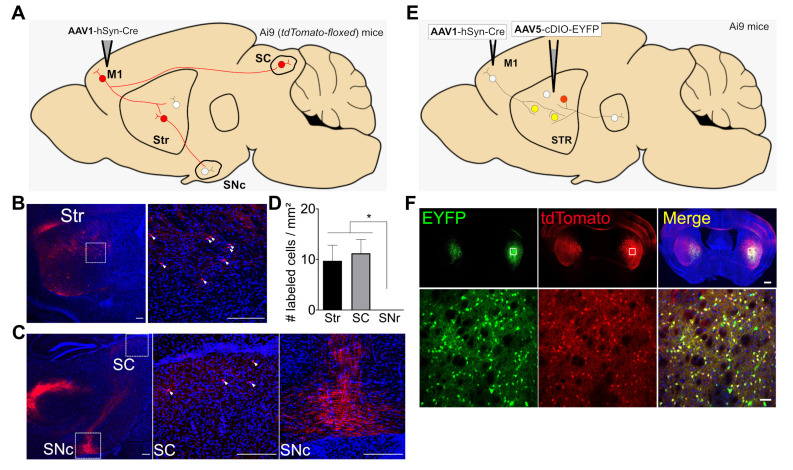
Anterograde monosynaptic tracing of AAV1-hSyn-Cre in Ai9 mice. (A) Schematic diagram for testing AAV1 as a monosynaptic anterograde viral vector. AAV1-hSyn-Cre was injected into the primary motor cortex (M1). The expected expression of tdTomato in the M1-connected postsynaptic neurons in the striatum (Str), superior colliculus (SC), and substantia nigra pars compacta (SNc) is shown as cell bodies with red color. (B) Left: representative fluorescence image showing the distribution of tdTomato (red)-expressing cells with DAPI staining (blue) in the Str (red). Right: a magnified view of tdTomato-expressing cells (white arrowheads) in the Str; scale bar: 200 μm. (C) Left: Representative fluorescence image showing the distribution of tdTomato (red)-expressing cells in the SC or SNc. Middle: a magnified view of tdTomato-expressing cells (white arrowheads) in the SC. Right: a magnified view of tdTomato-expressing neurites (no cell bodies detected) in the SNc; scale bar: 200 μm. (D) The bar graph depicts the average numbers of tdTomato-expressing cells with standard error of means (SEM) in the observed brain areas (# labeled cells/mm2) from 3 slices (pooled from 2 mice). *p<0.05, one-way ANOVA with Tukey’s multiple comparison test. (E) Schematic diagram for testing presynaptic AAV1-hSyn-Cre-mediated postsynaptic expression of EYFP and tdTomoto. AAV1-hSyn-Cre was injected into the M1 and AAV5-cDIO-EYFP into the Str. (F) Above: Representative fluorescence images showing the distribution of EYFP (green) or tdTomato (red)-expressing cells in the striatum; scale bar: 500 μm. Below: magnified views of EYFP or tdTomato-expressing cells in the indicate area (white boxed in above) in the striatum; scale bar: 50 μm.

