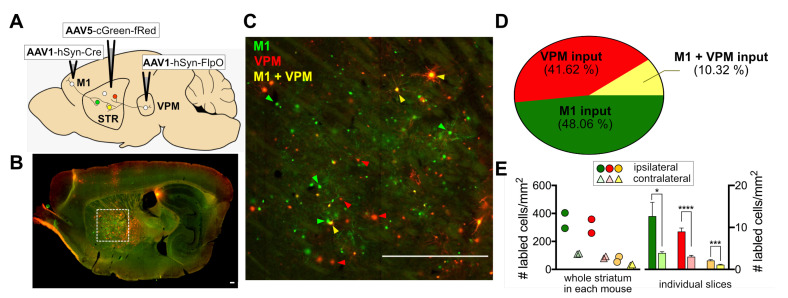
Fig. 5.
Labeling corticostriatal and thalamostriatal pathways using cFork. (A) Experimental scheme for simultaneous labeling of corticostriatal and thalamostriatal pathways in the striatum. AAV1-hSyn-Cre and AAV1-hSyn-FlpO were injected in the right hemisphere of two different presynaptic inputs of the striatum, the primary motor cortex (M1) and the ventral posteromedial (VPM) thalamic nucleus, respectively. AAV5 containing a dual gene expression cassette (EF1a-cDIO-EGFP-CMV-fDIO-mScarlet) was bilaterally injected into the postsynaptic striatum. (B) Representative fluorescence images showing EGFP and/or mScarlet expression in striatal neurons injected with AAV1 and AAV5 as described in B; scale bar: 200 μm. (C) Enlarged fluorescence image of the indicated area in B (the box with white dotted line) showing mixed fluorescence protein (FP) expression. Examples of EGFP (green arrowhead), mScarlet (red arrowhead), or EGFP+mScarlet co-expression (yellow arrowhead) in the ipsilateral striatum are indicated; scale bar: 200 μm. (D) The pie chart illustrates the percentage of striatal neurons labeled as cells receiving M1- (EGFP), VPM- (mScarlet), and M1+VPM- (EGFP+mScarlet) inputs. (E) Left: Each circle (ipsilateral) or triangle (contralateral) represents cell densities (number of cells/mm2) of FP-expressing cells counted from the whole striatum of each mouse, with EGFP (green; M1-input), mScarlet (red; VPM-input), or EGFP and mScarlet (yellow; M1+VPM-input). Right: bar graphs depict average cell densities of FP-expressing cells (mean±SEM) from individual striatal slices. Same colors as left. *p<0.05, ***p<0.001, ****p<0.0001, unpaired t-test.

