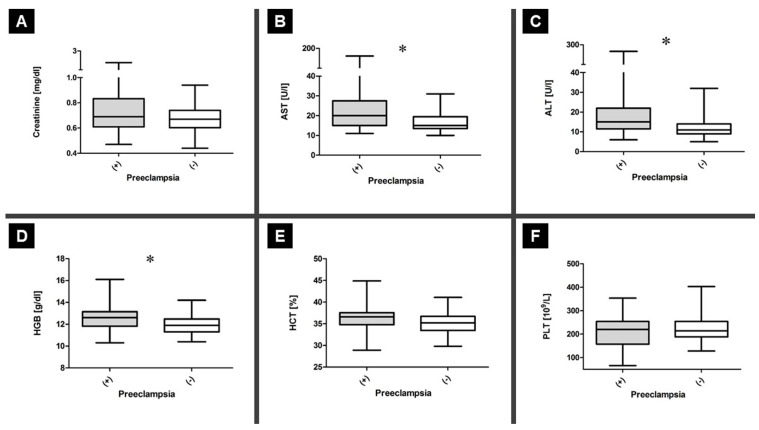
Figure 3.
General biochemistry testing. The levels of creatinine (A), AST (B), ALT (C), hemoglobin (Hgb0) (D), hematocrit (HCT) (E), and platelet count (PLT) (F) were compared between the PE and GH groups. Significant differences in AST, ALT, and PLT (F) were compared between the PE and the GH groups. Significant differences in AST, ALT, and platelet count were noted and indicated with “*”; * p < 0.05.

