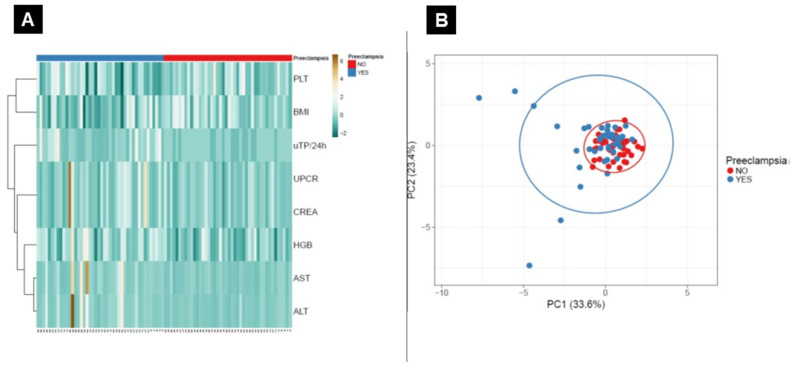
Figure 4.
Heat maps and principal component analysis (PCA) analysis. Heat maps based on the Euclidean distance between clusters for patients with PE and GH (A). PCA graph for the PE and GH groups (B). The X and Y axes show principal component 1 and principal component 2, which explain 33.6% and 23.4% of the total variance, respectively.

