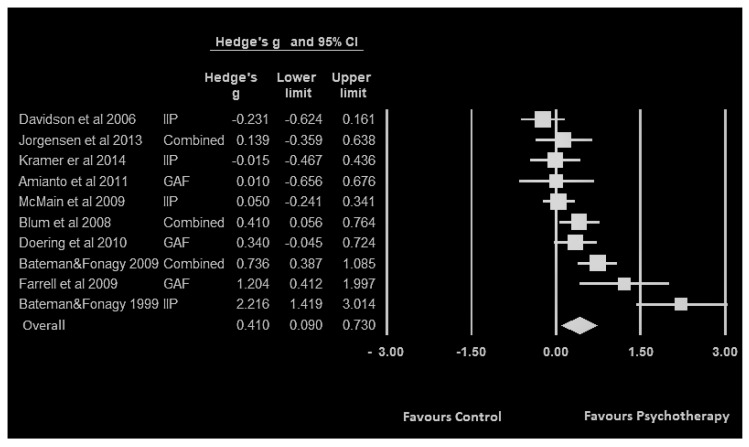
Figure 1.
Forest plot and Hedge’s g (effect size) of each included study with their 95% confidence Interval (CI) upper limit and lower limit comparing psychosocial functioning of the BPD specific treatments in the intervention group versus non-specific treatment in the control group in the ten included studies.

