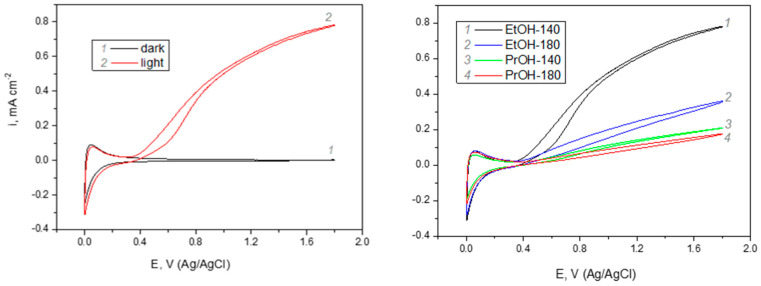
Figure 6.
Photoelectrochemical response of FTO/WO3 samples formed under different synthesis conditions: (a) cyclic voltammograms of sample EtOH-140 in dark and under illumination; (b) cyclic voltammograms of indicated samples under illumination; solution 0.5 M H2SO4, potential scan rate of 50 mV s−1, intensity of illumination~100 mW cm−2.

