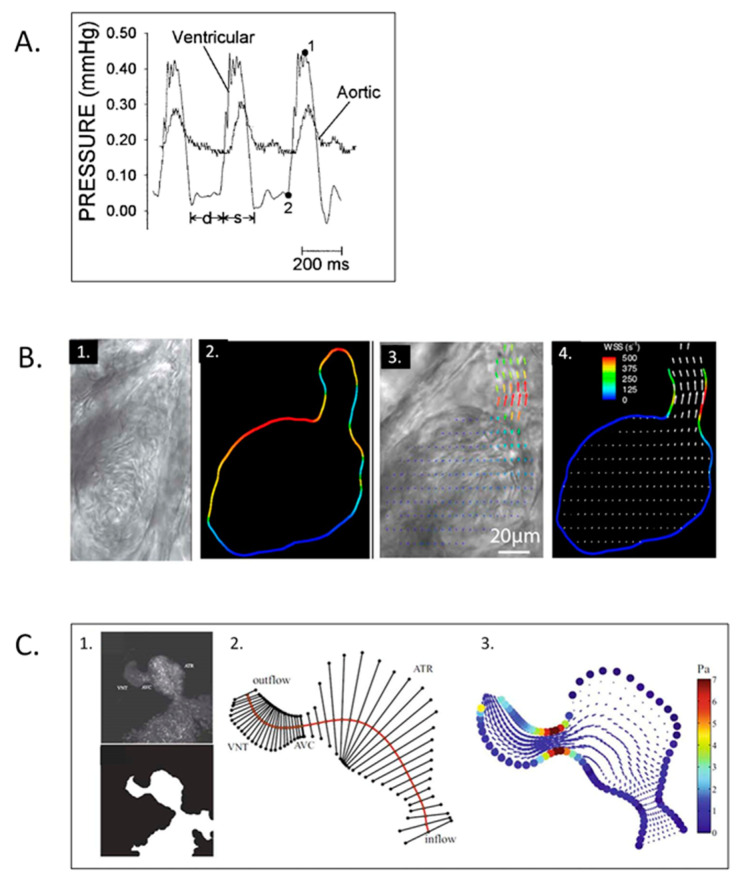
Figure 17.
Zebrafish embryo hemodynamics. (A) Representative ventricular and dorsal aortic pressure waveforms of a 5-day post-fertilization Zebrafish. D-diastolic and s-systolic time intervals, 1-ventricular peak pressure and 2-ventricular end-diastolic pressure. Scale bar = 200 msec. This was adapted with permission [261]. (B) Velocity and wall shear stress (WSS) measurements via digital particle image velocimetry for Zebrafish embryos. 1. Brightfield image for the ventricle of a 4-dpf Zebrafish embryo; 2. vessel boundaries are determined as the limits of cell movements; 3. velocity vectors for cell movements; 4. calculated wall shear rates overlaid with velocity vectors. This was adapted with permission [275]. (C) Coupled confocal imaging and computational modeling approach for Zebrafish heart hemodynamics. 1. Segmentation of the heart wall from maximum intensity projection of a confocal scan for a 48-hpf embryo; 2. cross-section segments through the heart and their intersection points with the wall. ATR, atrium; VNT, ventricle; AVC, atrioventricular canal; 3. velocity vectors and WSS levels from the in silico computational fluid dynamics (CFD) model at peak systole. Adapted with permission [275].

