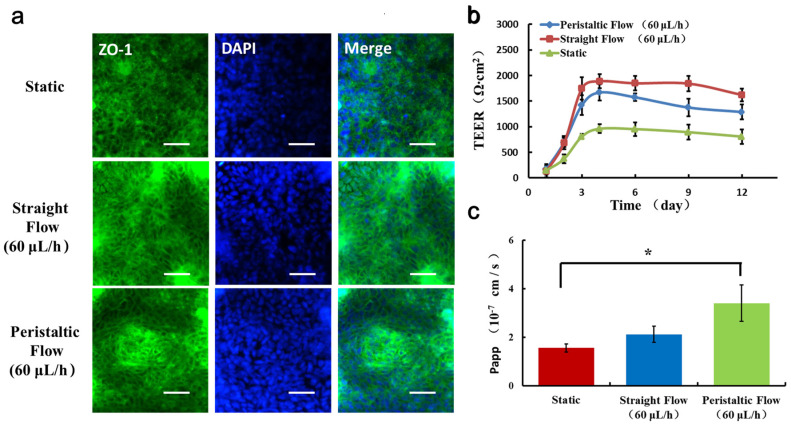
Figure 4.
Evaluation of intestinal barrier functions under different flow conditions. (a) Immunofluorescent images show the expression of tight junction protein, ZO-1 (green), in the Caco-2 monolayer. Bars: 50 μm. (b) The barrier integrity of the Caco-2 monolayer was quantified by TEER. (c) The apparent permeability coefficient (Papp) was measured by quantifying FD20 transport across the Caco-2 monolayer under different conditions. N = 3, * p < 0.05.

