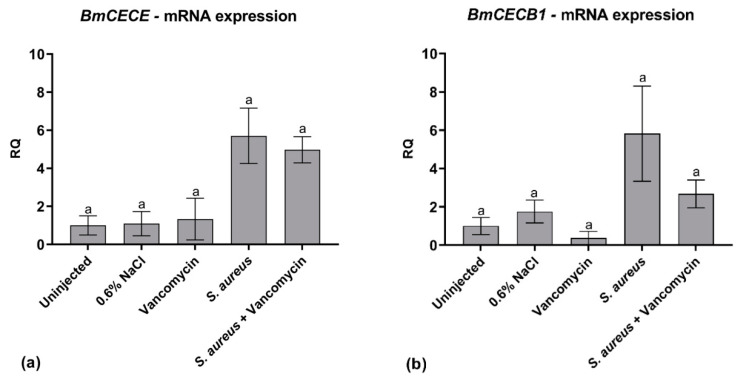
Figure 6.
Quantitative reverse transcription PCR (qRT-PCR) analysis of BmCECE (a) and BmCECB1 (b). mRNA levels in control larvae (uninjected larvae and larvae injected only with physiological solution) and in healthy and infected larvae treated and untreated with vancomycin (8.75 μg/g body weight). Values represent mean ± s.e.m. Different letters indicate statistically significant differences among treatments (p < 0.05).

