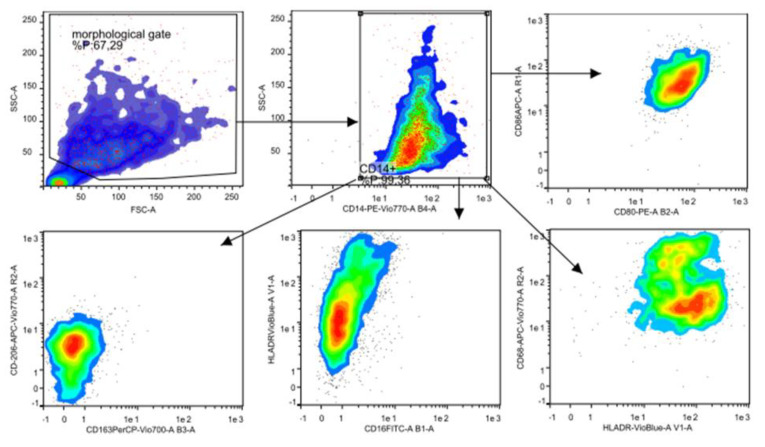
Figure 4.
Gating strategy used for the analysis of M1 and M2 phenotype. For the analysis of human macrophage differentiation phenotype, cells were harvested and analyzed by flow cytometry. Morphological gating (top left) was used to exclude cell debris from analysis. The CD14+ monocyte differ from CD14-, in order to identify macrophages, CD14+ cells were identified (top middle). Next, CD14+ cells were analyzed for their expression of CD80 and CD86 (top right red and yellow), HLA-DR and CD68 (bottom right light green and orange), CD16 and HLA-DR (bottom middle blue) and CD163 and CD206 (bottom left green/light blue). Median fluorescence intensity of each marker was extracted by using the FlowLogic software, low-auto fluorescent cells that strongly express MHCII and CD14+ hi, high-auto fluorescent cells are marked as macrophages.

