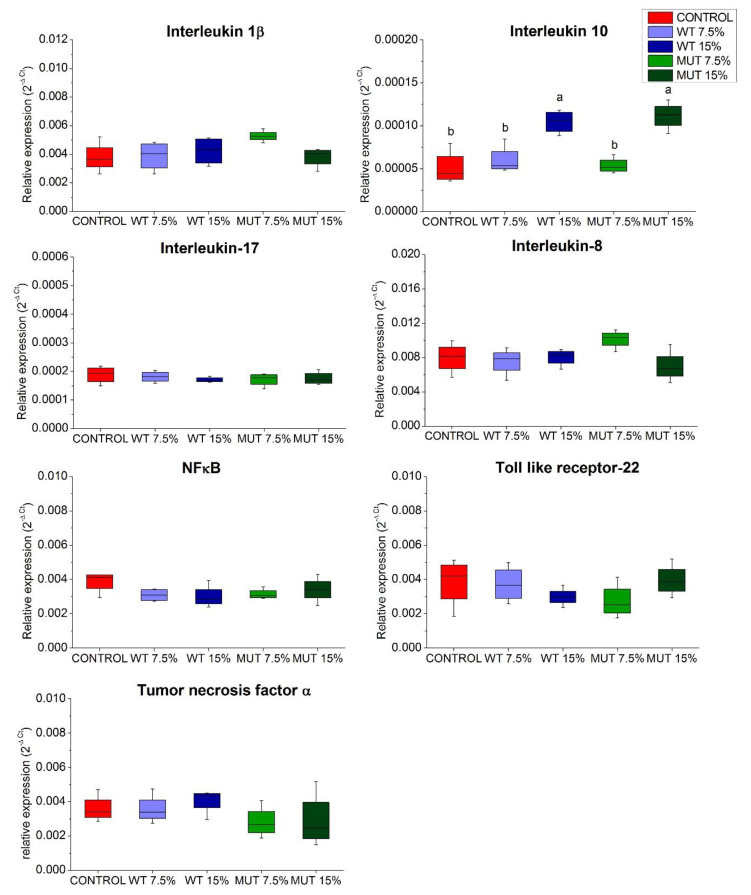
Figure 2.
Expression of inflammatory cytokine genes in the gut of zebrafish fed diets supplemented with Lobosphaera incisa wild type (WT) and mutant strain (MUT). Values in box plots show relative gene-expression levels normalized to EF1α and expressed as 2−ΔCt (n = 4 biological replicates, each replicate is a pool of five fish). Different lowercase letters denote significant differences (p < 0.05) between treatments.

