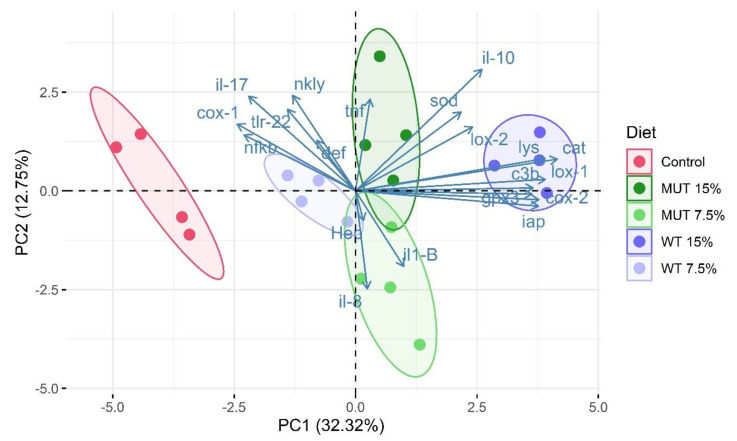
Figure 5.
Principal component analysis showing clustering of replicate aquaria (each consisting of a pool of five sampled fish) fed the different diets, on the basis of gene-expression profile. Samples are displayed with respect to the first two components and are colored according to diet. Each colored dot represents an individual biological replicate (n = 4). The amount of variance explained by each principal component axis is shown in parentheses. Control, nonsupplemented diet; WT, diet supplemented with wild-type Lobosphaera incisa; MUT, diet supplemented with mutant strain of L. incisa.

