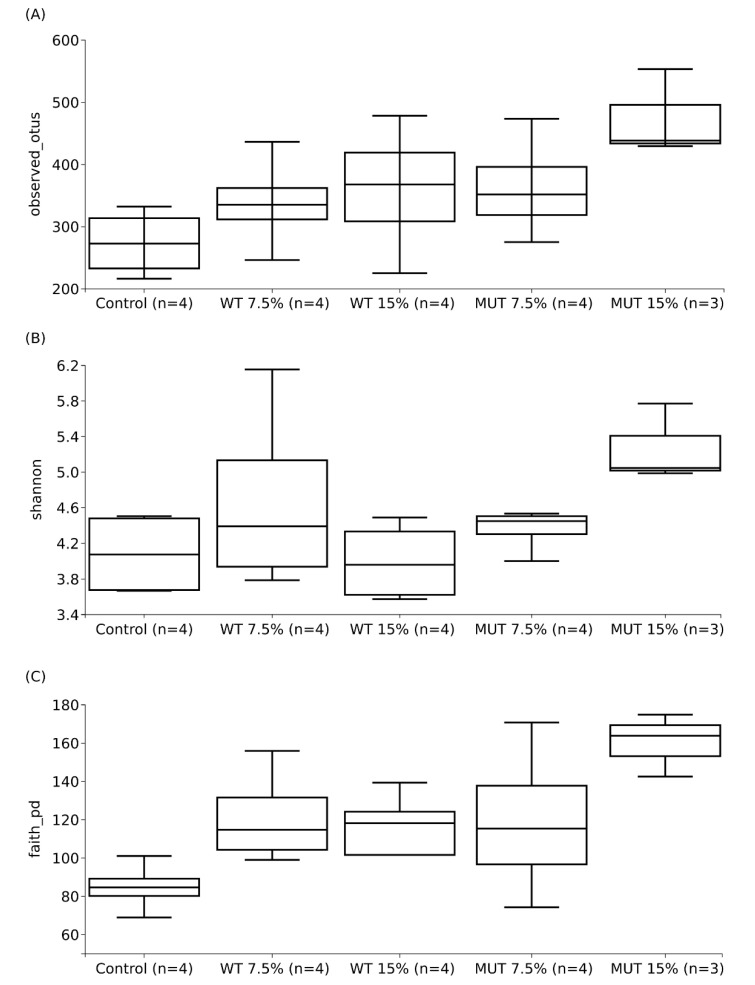
Figure 6.
Average microbial diversity indices of (A) the observed number of operational taxonomic units (OTUs), (B) Shannon diversity, and (C) Faith’s phylogenetic diversity, for different diets (control, WT 15%, WT 7.5%, MUT 15%, and MUT 7.5%) and their standard deviations. The number (n) on the x-axis indicates total experimental replicates; each experimental replicate is a composite of guts from five individual fish. Control, nonsupplemented diet; WT, diet supplemented with wild-type Lobosphaera incisa; MUT, diet supplemented with mutant strain of L. incisa.

