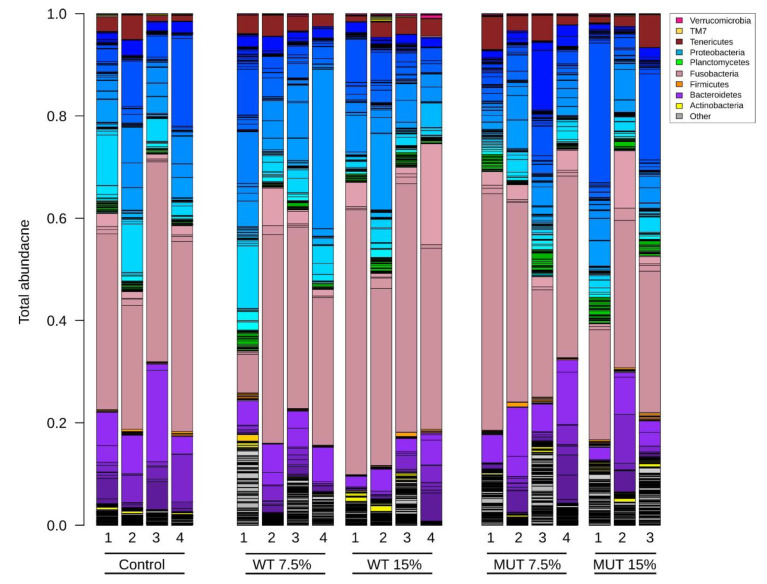
Figure 7.
Total microbial community composition in zebrafish fed the different diets. Different colors in each bar represent the different bacterial phylum compositions, while shades of the same color represent different OTUs within the same phyla. Control, nonsupplemented diet; WT, diet supplemented with wild-type Lobosphaera incisa; MUT, diet supplemented with mutant strain of L. incisa.

