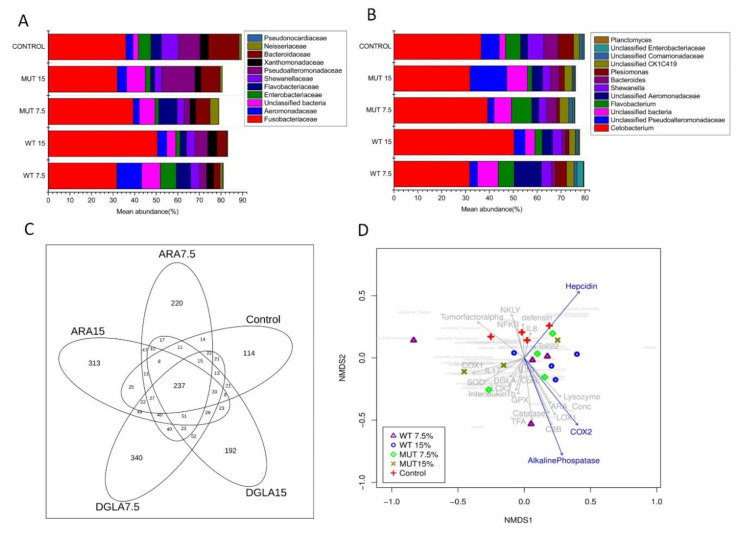
Figure 9.
Relative abundance of bacteria at the family (A) and genus (B) levels in the gut of zebrafish fed different diets. Values for average relative abundance (%) of only the dominant families or genera obtained after taxonomic assignment of bacterial 16S rRNA gene sequences are shown. Individual phyla are indicated by different colors. (C) Venn diagram showing unique and shared bacterial OTUs at 97% sequence similarity among different dietary treatment groups. The numbers in the overlapping circles indicate OTUs shared by the experimental groups. (D) Nonparametric multidimensional scaling (NMDS) ordination illustrating the effects of different dietary supplementation (WT, MUT at 7.5 and 15%, and control) on fish gut bacterial community. The plot also includes the tested significant and nonsignificant immune gene expression profiles (blue and gray arrows, respectively) and the microbial species distribution (97% of total species abundance, in light gray in the background). Control, nonsupplemented diet; ARA, diet supplemented with wild-type Lobosphaera incisa; DGLA, diet supplemented with mutant strain of L. incisa.

