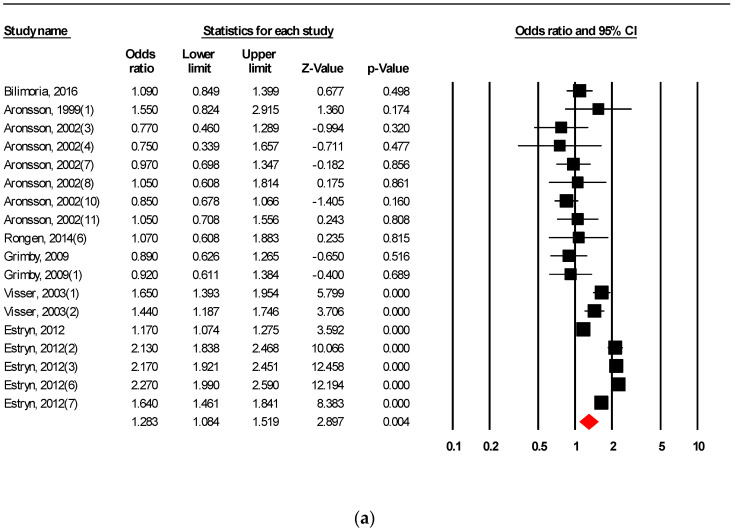
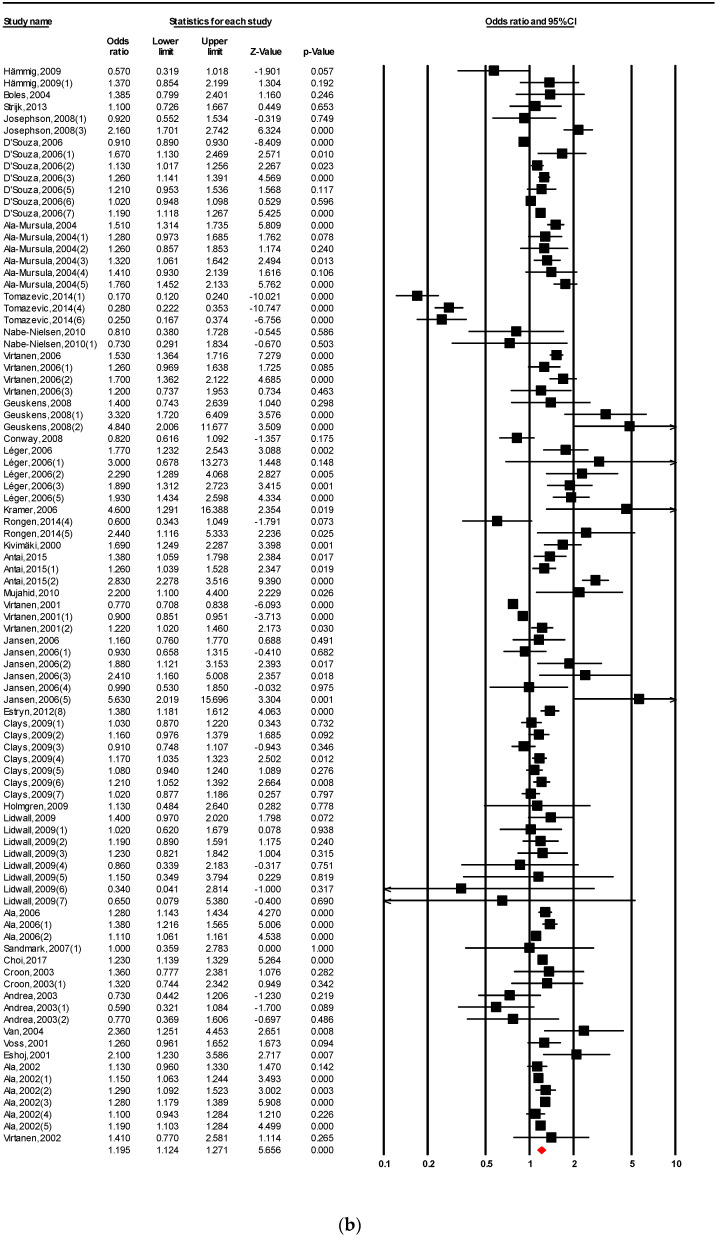
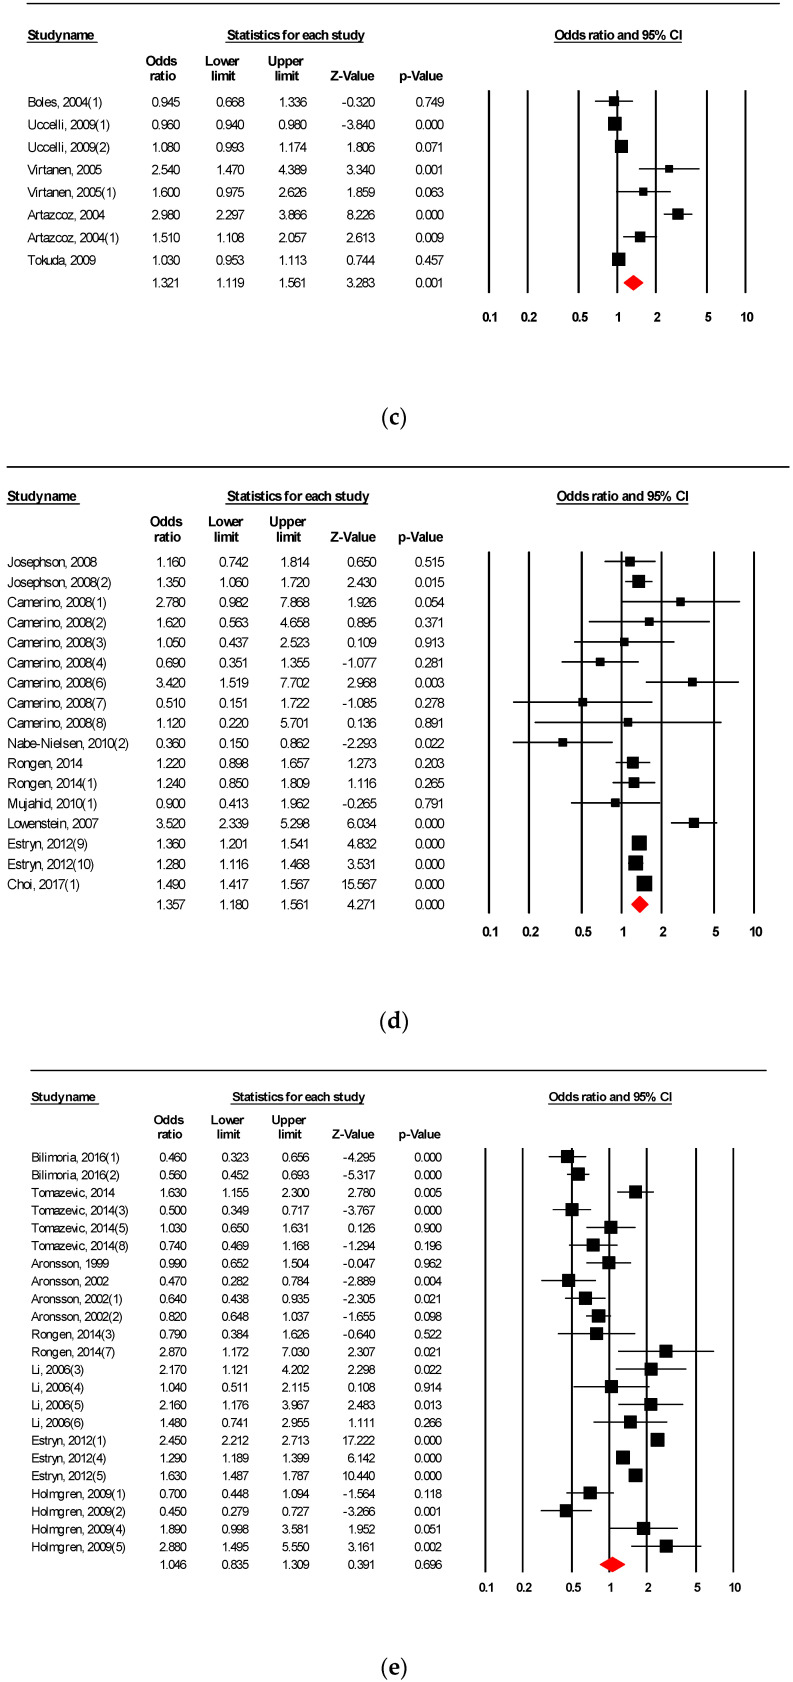
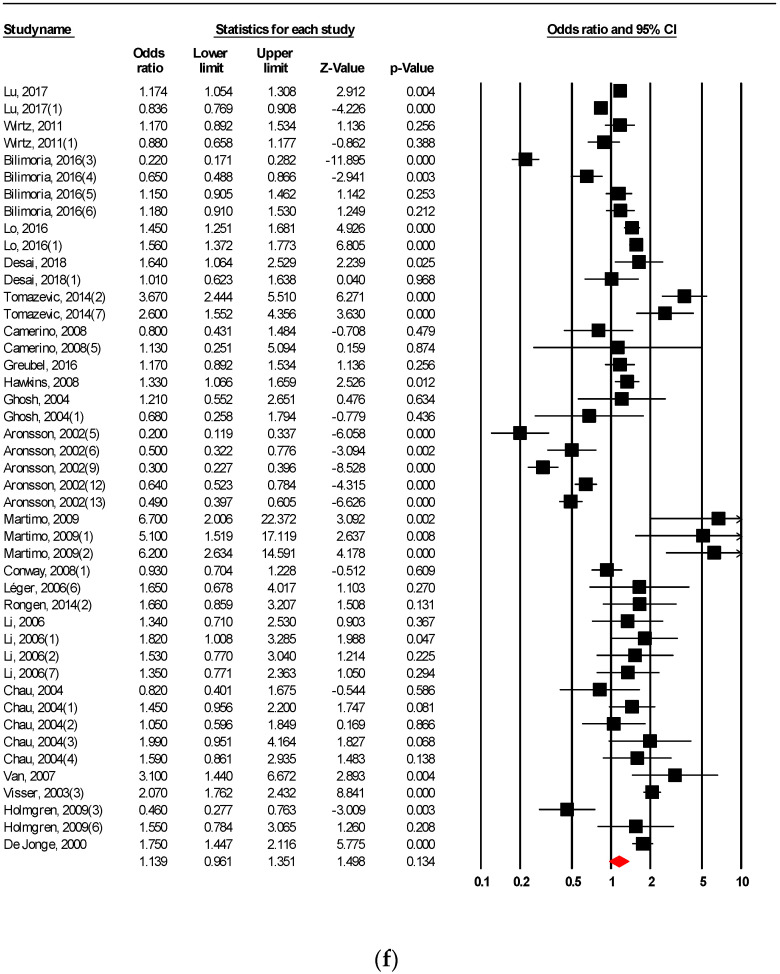
Figure 2.
Forest plot of (a) career motivation (CM), (b) employee attendance (EA), (c) employee recruitment (EC), (d) employee retention (ET), (e) organisational commitment (OC), and (f) productivity (PR). Note: In this forest plot, the midpoint of a square provides the odds ratio estimated for the study. The area of the square is proportional to the weight of the study in the meta-analysis. The width of the horizontal line shows the confidence interval. The centre of the diamond represents the overall odds ratio, and its width refers to the confidence interval.


