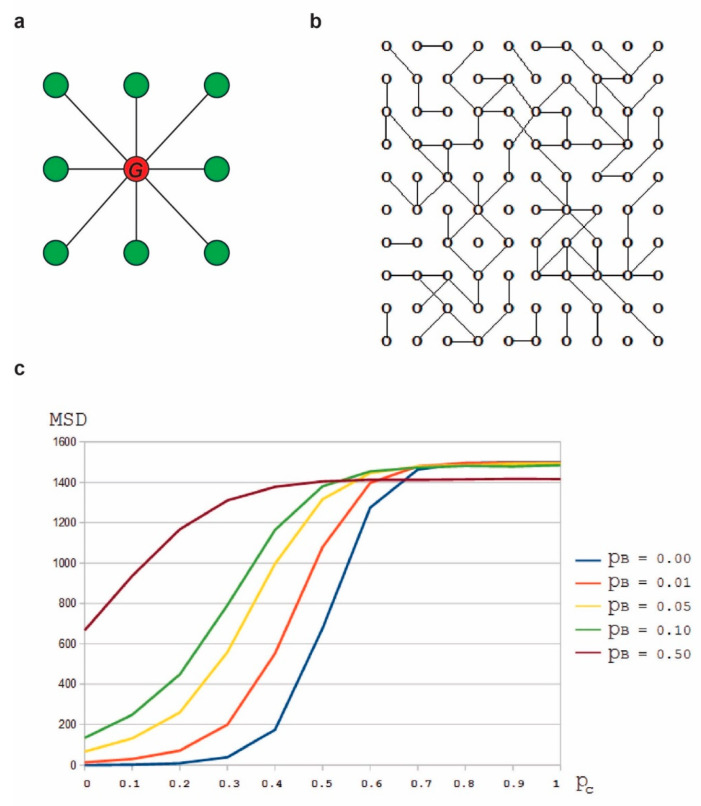
Figure 4.
(a) Neighborhood of the red node consists of the set of green nodes. We connect the red node with each of the green nodes in its neighborhood with a probability . We do this by generating a random number between and for each of the green nodes and check if this random number is less than . If this is the case, then the red node and the green node are connected, otherwise they are not connected. (b) An example of a small cellular graph with . (c) versus diagram, for different values of (the probability of a particle to reach a neighbor node by Brownian motion.

