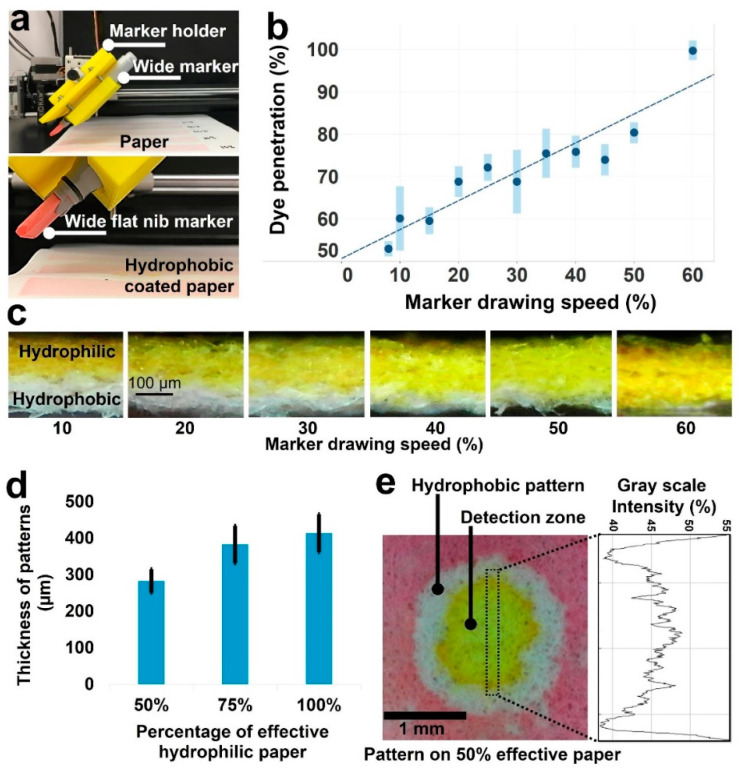
Figure 2.
Evaluation of decreasing effective paper thickness on the resolution of patterns. (a) The custom-designed wide marker holder connected to the pen plotter to deposit a layer of hydrophobic ink on the chromatography paper. (b) Graph of percentage of food dye penetration through the thickness of paper (indicating the effective hydrophilic thickness of paper) versus the plotting speed percentage used to plot hydrophobic solution on the backside of chromatography paper. (c) Images of chromatography paper cross-sections after being coated with hydrophobic solution using the wide marker plotted for various speeds. The yellow food dye is applied to the hydrophilic side of paper to distinguish it from the hydrophobic side of paper. (d) Graph of line thickness of patterns on the chromatography paper with 50%, 75%, and 100% effective thickness (N = 6 and the error bar shows the standard deviation). (e) Image of a circular pattern (2 mm diameter) on the chromatography paper with 50% effective thickness and grayscale intensity analysis of food dye in detection area.

