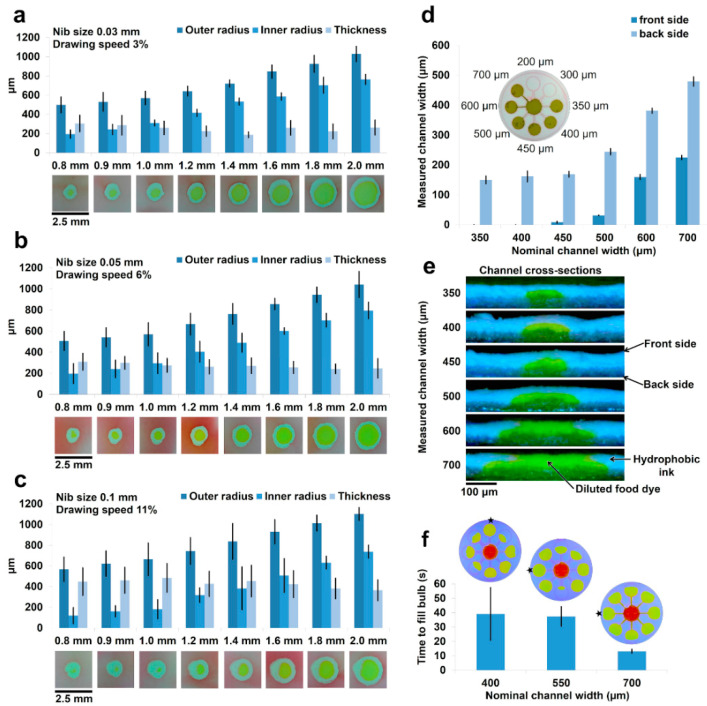
Figure 4.
Characterization of high-resolution fabrication of detection zones and channels. (a) The resolution of 0.03 mm fiber technical pen on regenerated paper with optimal 3% drawing speed (N = 9 and the error bar shows the standard deviation); (b) the resolution of 0.05 mm fiber technical pen on regenerated paper with optimal 6% drawing speed (N = 9 and the error bar shows the standard deviation); (c) the resolution of 0.1 mm fiber technical pen on regenerated paper with optimal 11% drawing speed (N = 9 and the error bar shows the standard deviation). The results measured using MATLAB script at 8 angles around each reaction area across reaction areas. (d) The graph of the measured microfluidic flow channel width versus the plotted channel width (N = 8 and the error bar shows the standard deviation). The channels are plotted using the 0.1 fiber technical pen with 11% drawing speed and the channel widths are measured in ten equidistant locations using ImageJ software across three test repeats. (e) The cross-sectional image taken of each channel. The channels are filled with yellow food dye to clarify channel vs. barrier. (f) The average time to fill bulb for each corresponding equal channel test (N = 8 and the error bar shows the standard deviation). The color-altered images above the chart display the flow state as the first bulb was completely filled (star marks first bulb to fill).

