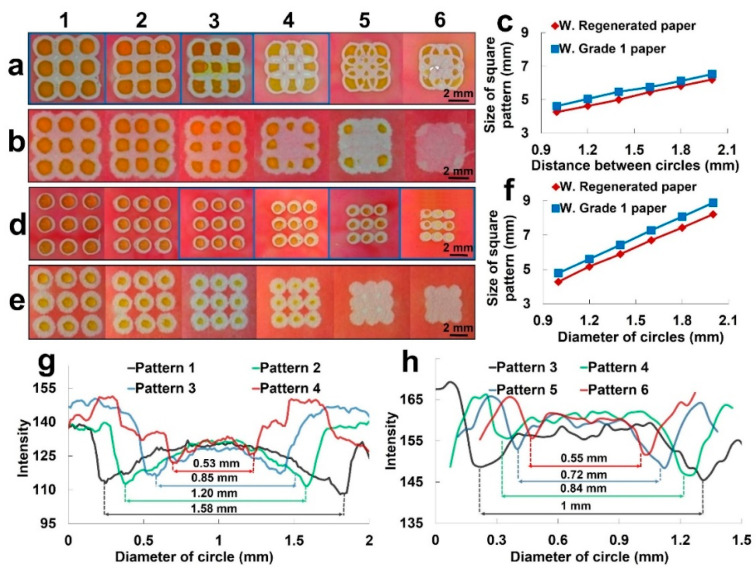
Figure 5.
Packing density analysis of closely patterned detection zones. (a,b) High-resolution packing of detection zones on Whatman regenerated paper (a) and Whatman grade 1 paper (b). The diameter of circles in each pattern is 2 mm. The center-to-center distance between adjacent circles starts at 2 mm in the first pattern and decreases by 0.2 mm in each pattern. (c) Graph of pattern size versus center-to-center distance between adjacent circles in subfigure a and b (N = 9 and the error bar shows the standard deviation). (d,e) High-resolution fabrication of detection zones on Whatman regenerated paper (d) and Whatman grade 1 paper (e). The diameter of circles and center-to-center distance in the first pattern is 2 mm and 3 mm, respectively. The diameter of circles and the center-to-center distance between adjacent circles decrease by 0.2 mm and 0.3 mm in each pattern, respectively (the diameter of circles and the center-to-center distance of pattern 6 are 1 mm and 1.5 mm, respectively). (f) Graph of pattern size versus diameter of circles of subfigures d and e (N = 9 and the error bar shows the standard deviation). (g) Graph of grayscale intensity analysis of food dye in detection zone of pattern 1–4 of subfigure a. (h) Graph of grayscale intensity analysis of food dye in detection zone of pattern 3–6 of subfigure d.

