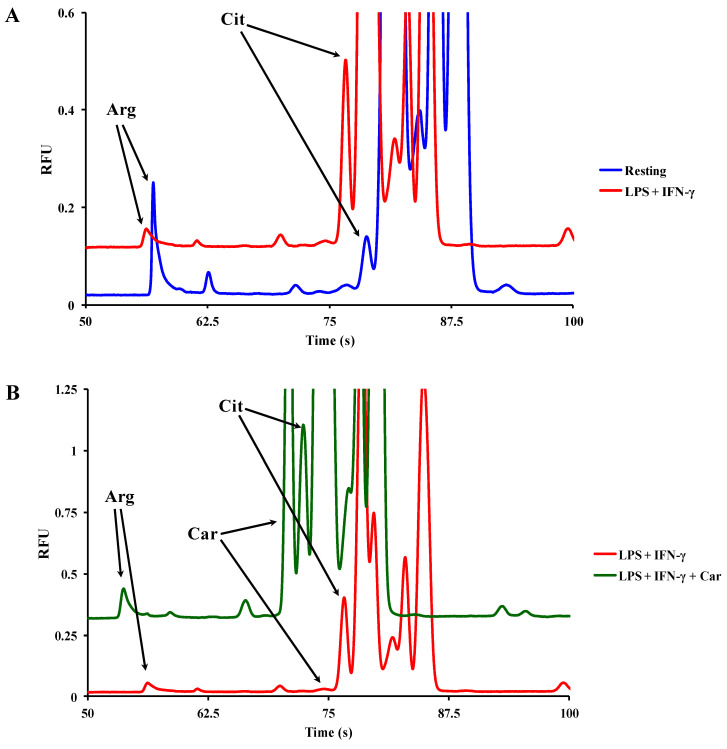
Figure 3.
Representative electropherograms of cell lysates showing the change in peak area of Arg, Cit, and carnosine (Car) (A) for resting (untreated) macrophages (blue line) and (B) for macrophages stimulated with LPS + IFN-γ, in the absence (red line) or in the presence (green line) of carnosine. RFU = relative fluorescent unit.

