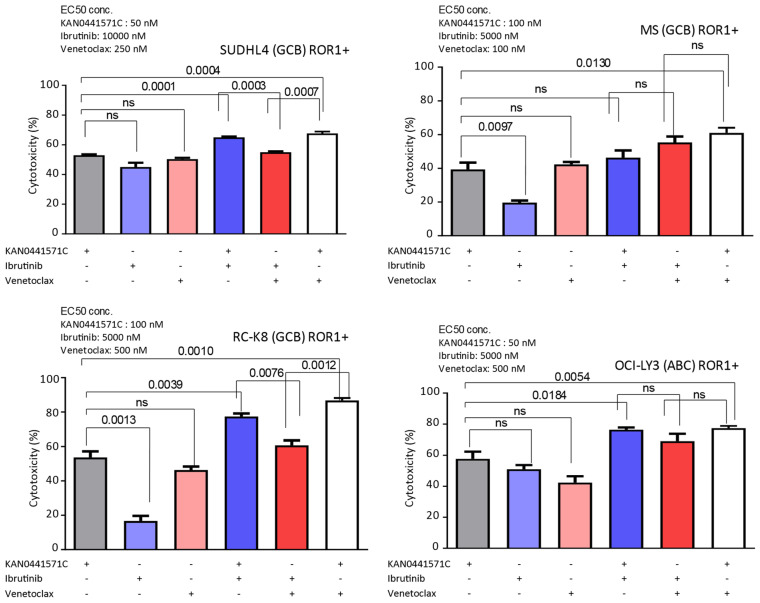
Figure 6.
Cytotoxicity of four different ROR1+ DLBCL cell lines treated in vitro with combinations of EC50 concentrations of KAN0441571C, ibrutinib and venetoclax respectively (see upper left corner) alone and in combinations. Significant differences are shown at the top. Data present the mean ± SEM of three independent experiments. Using the Bonferroni method to correct for multiple testing all p-values below 0.002 remained significant while those above 0.0039 become non-significant

