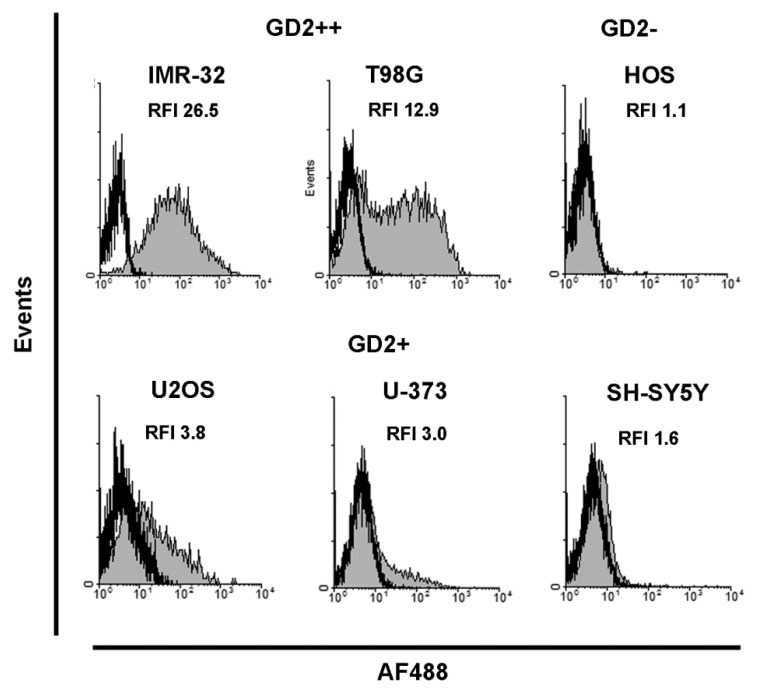
Figure 1.
Ganglioside GD2 surface expression in cancer cell lines analyzed by flow cytometry. Gray histograms represent staining with anti-GD2 monoclonal antibodies, empty histograms represent autofluorescence of unstained cells. RFI (relative fluorescence intensity)—the ratio of specific fluorescence of cell staining with AF488-labelled antibodies 14G2a and autofluorescence of control unstained cells.

