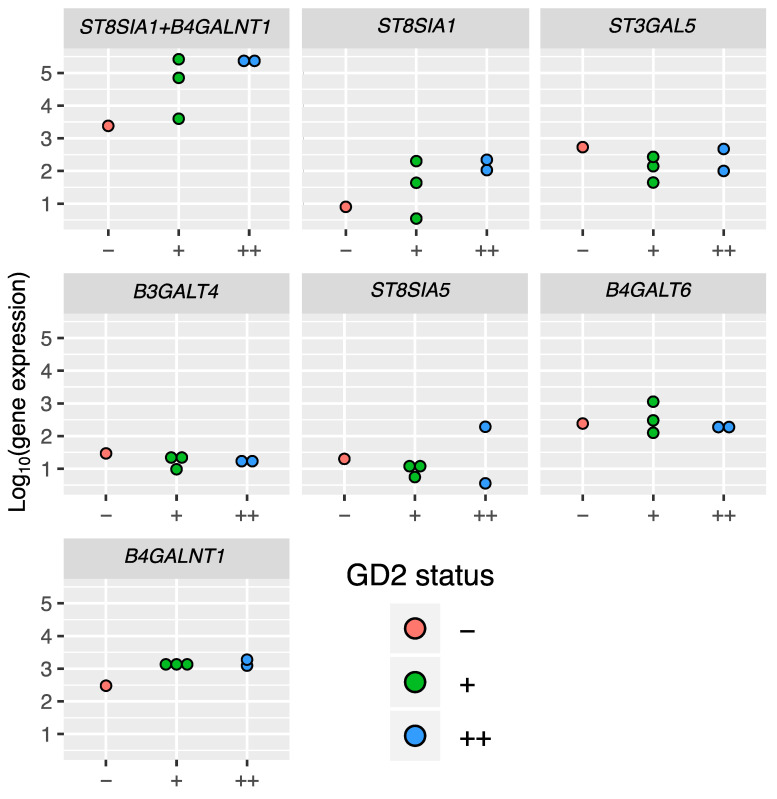
Figure 3.
Expression of GD2 biosynthesis enzyme genes in cell lines with different GD2 status. Each panel, except ST8SIA1 + B4GALNT1, corresponds to a single gene and contains log10-transformed normalized gene expression values for cell lines of three GD2 phenotypic groups (GD2++, GD2+, and GD2−). The panel ‘ST8SIA1 + B4GALNT1’ represents gene signature scores calculated as sum of log10-transformed gene expression values of genes ST8SIA1 and B4GALNT1.

