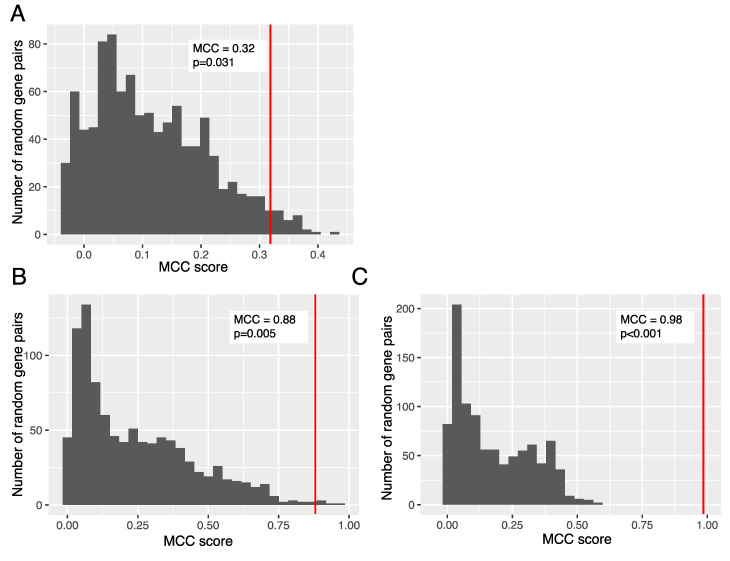
Figure 6.
MCC score difference between the GD2 gene signature (sum of log10-transformed expressions of ST8SIA1 and B4GALNT1) and 2-gene signatures consisting of randomly selected genes associated with lipid metabolism. (A) TNBC and non-TNBC samples from TCGA dataset, n = 981 samples, (B) brain tissues and all non-nerve tissue derived samples from GTEx dataset, n = 11491 samples, (C) putatively GD2-positive neuroblastoma samples and putatively GD2-negative leukemia samples from TARGET dataset, n = 696 samples.

