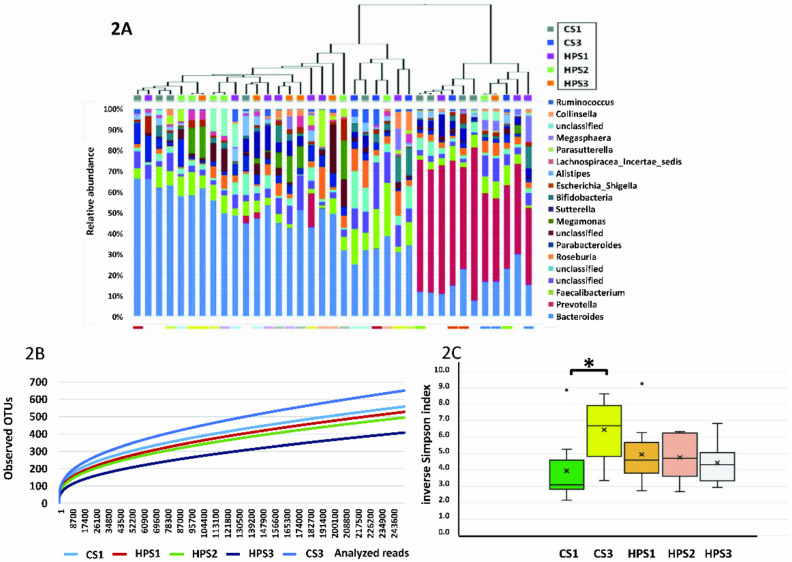
Figure 2.
The dendrogram of hierarchical clustering and microbiota composition at the genus level in the 37 fecal samples (A). The rarefaction curves (B) and inverse Simpson index (C) of microbiota between the five groups (CS1: non-H. pylori infected controls at enrollment; CS3: non-H. pylori infected controls 4 weeks after yogurt ingestion; HPS1: H. pylori-infected children at enrollment; HPS2: H. pylori-infected children after 4 weeks of yogurt ingestion; HPS3: H. pylori-infected children 4 weeks after eradication therapy. * p < 0.05.

