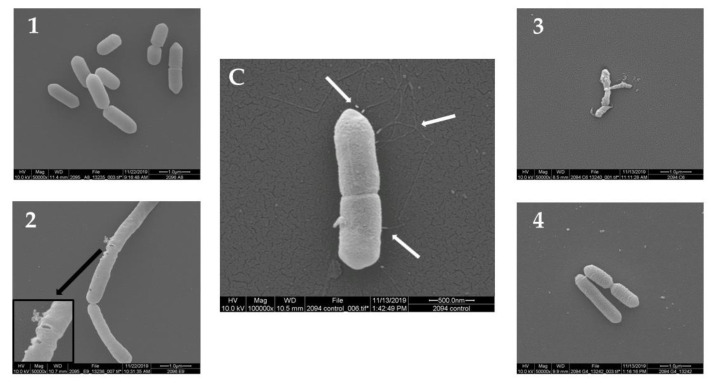
Figure 1.
Morphology of L. monocytogenes F2365 cells treated with plant extracts No. (1–4) (group A) observed using SEM, in comparison with L. monocytogenes F2365 that was not treated with samples—control (C). White arrows show flagella in (C). The black arrow shows pores in the cell membrane. Number/plant species correspondence is shown in Table 1.

