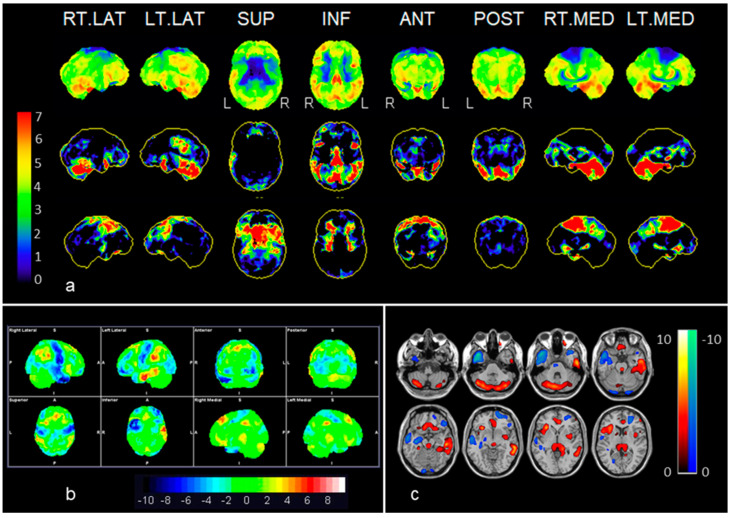
Figure 2.
Example of anti-NMDAR (case 1): Neurostat (a) and syngo.via Database Comparison (b) were superior to SPM (c) exhibiting bilateral frontal, right temporal, occipital and bilateral motor cortex hypometabolism, as well as more hypermetabolic areas including temporo-parietal, posterior cingulate and cerebellum. Color bars represent significant increases or decreases in brain metabolism compared to a normal database stratified by age. In the displayed Neurostat and SPM results, all the colored voxels represent statistical significance when compared to normal controls (Neurostat: increases and decreases in red to green; SPM: increases in, red to yellow, decreases in blue), whereas in the syngo.via Database Comparison, the significant voxels can be identified according to the SD color bar, 2 SD being the threshold of statistical significance (i.e., areas with green voxels are not significant). See also Table 2.

