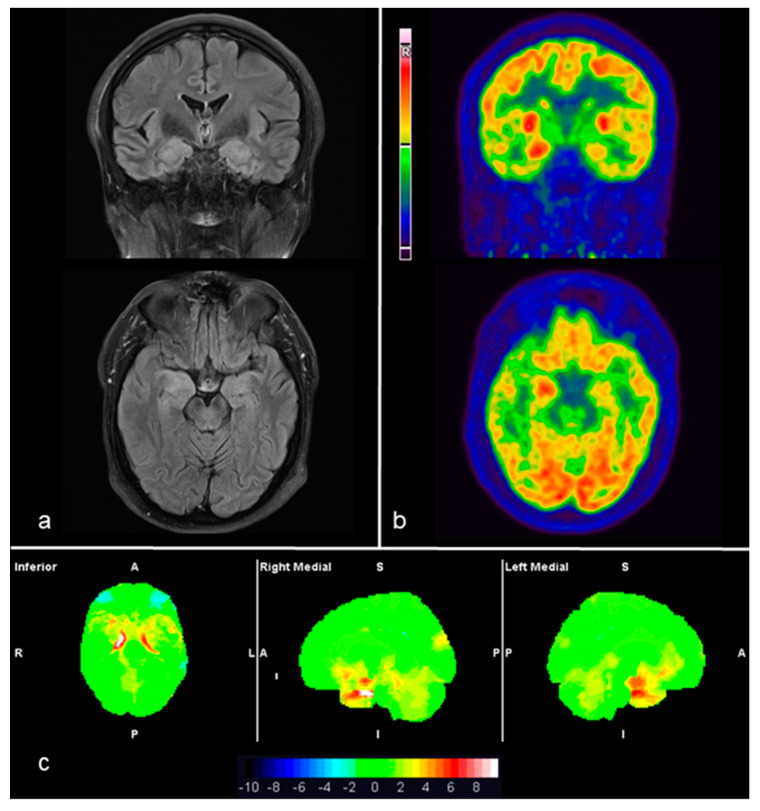
Figure 3.
Example of anti-CASPR2 (case 3): MRI-3T, T2-FLAIR axial and coronal slices (a) show medial temporal hyperintensity as well as swelling, predominantly on the right side. Corresponding 18F-FDG-PET/CT axial and coronal slices (b) showing right medial temporal hyperactivity. The syngo.via Database Comparison based analysis of FDG-PET images (c) exhibited a significant bilateral medial temporal hypermetabolism on the statistical surface projection (in red) with respect to a normal database. In the displayed syngo.via Database Comparison, the significant voxels can be identified according to the SD color bar, 2 SD being the threshold of statistical significance (i.e., areas with green voxels are not significant and areas with orange to red voxels are significant increases). See also Table 2.

