
Figure 2. Kaplan-Meier Curves of Major Adverse Cardiovascular Events Stratified by Achieved Lipoprotein(a) (Lp[a]) Quintiles in the Setting of Achieved High-Sensitivity C-Reactive Protein (hsCRP) Levels of Less Than 2 vs 2 mg/L or More.
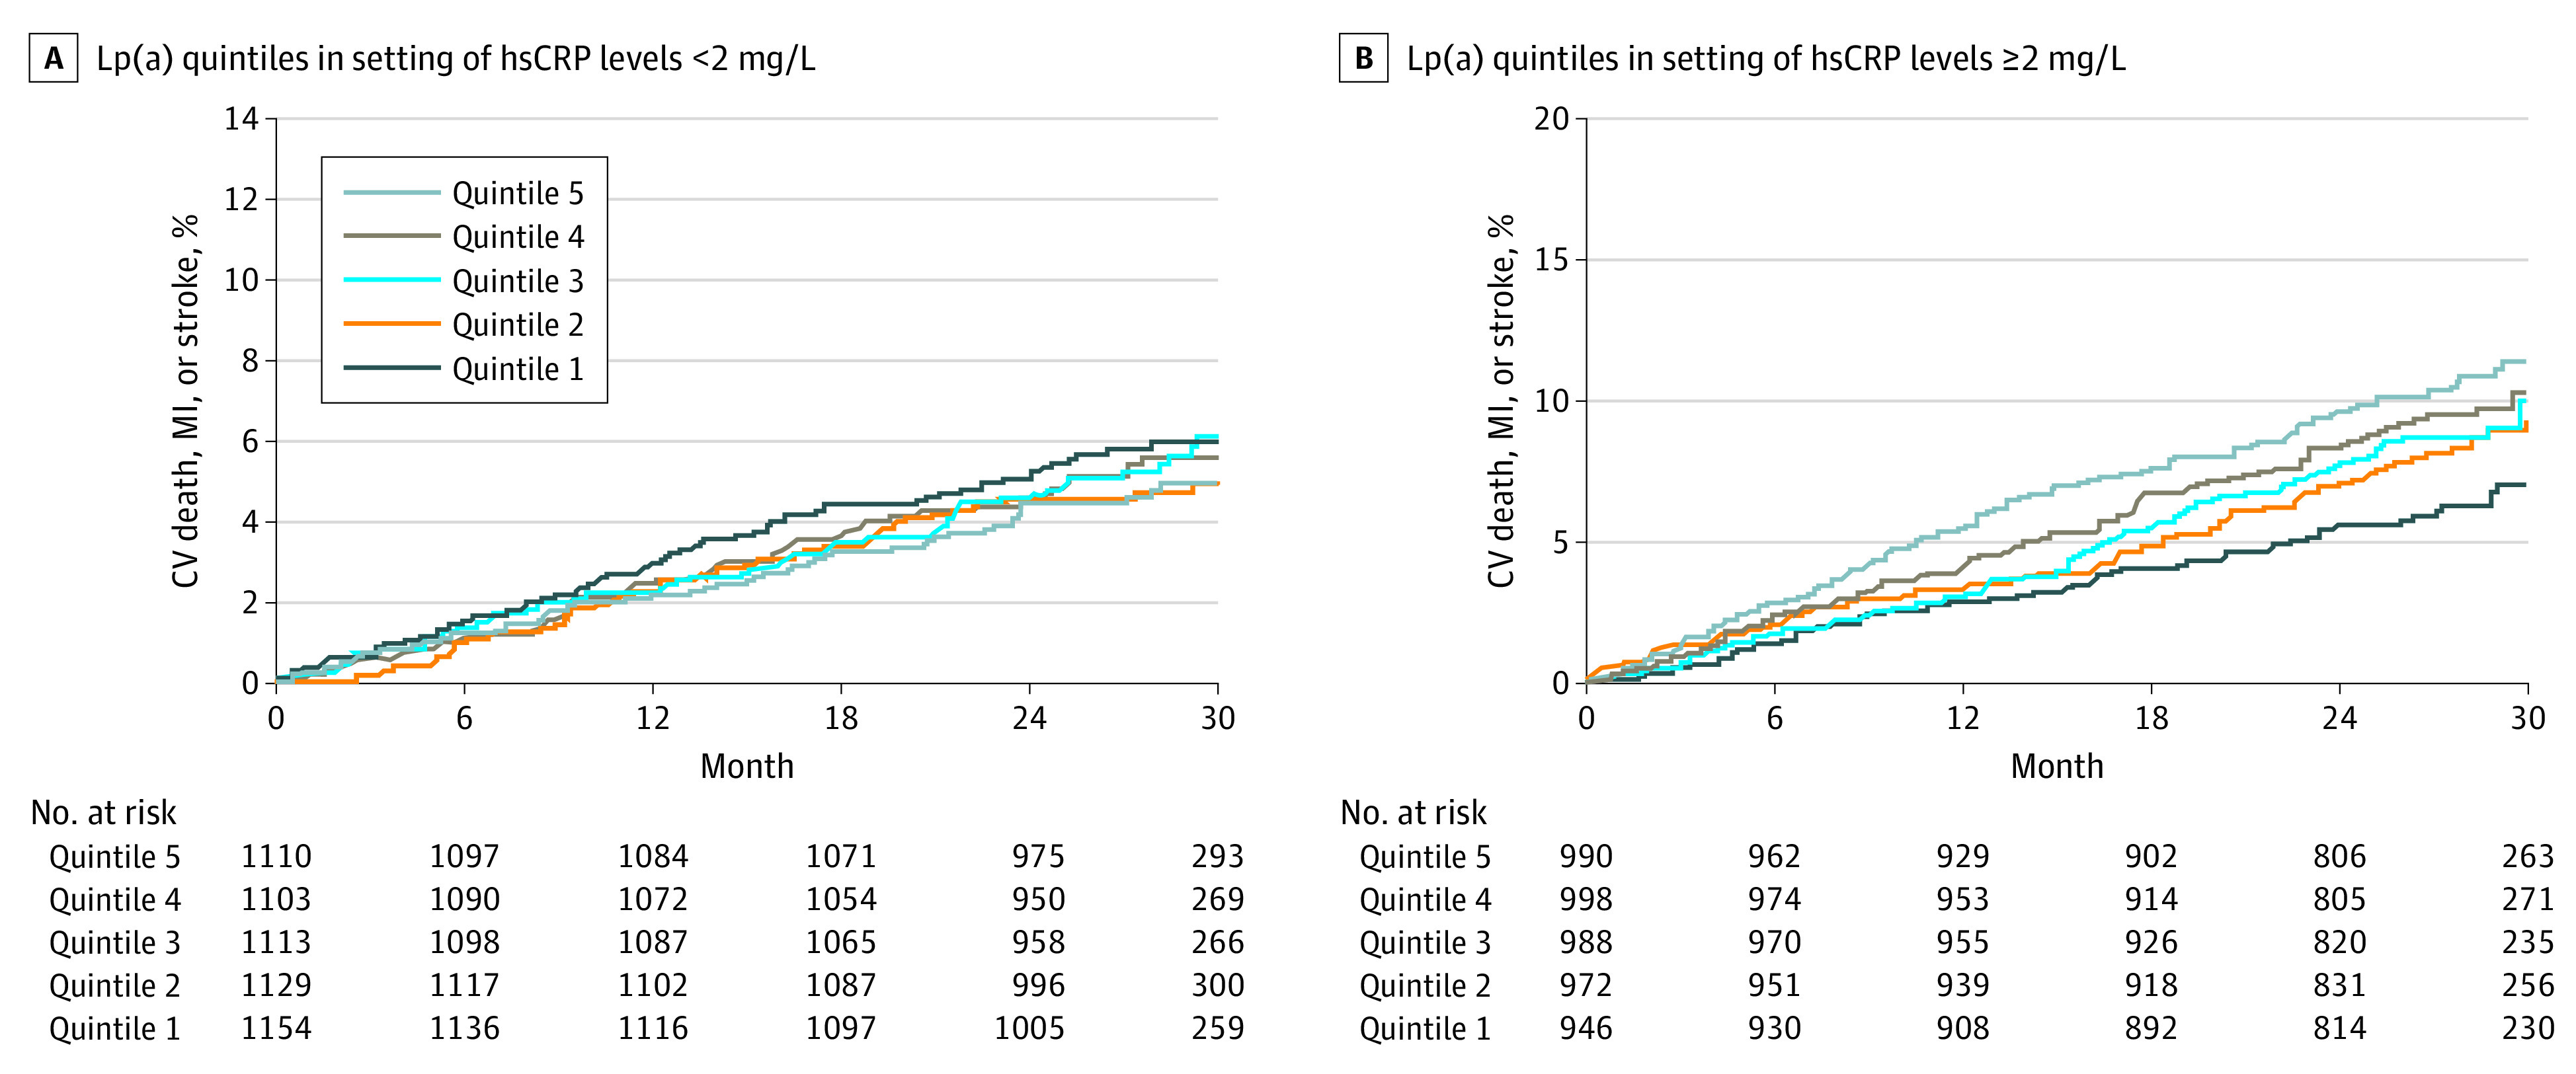
A, Test of trend across quintiles: P = .44. B, Test of trend across quintiles: P < .001. CV indicates cardiovascular; MI, myocardial infarction.