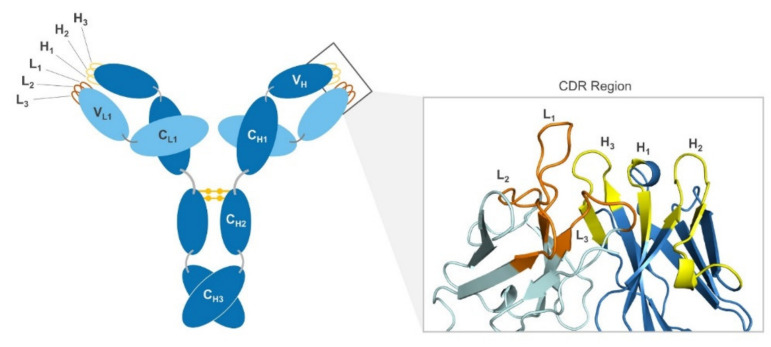
Figure 1.
Schematic of antibody and ribbon diagram of variable region. The heavy chain (H) of the antibody is depicted in dark blue, while the light chain (L) is shown in light blue. Both chains show labels C for constant region and V for variable region. The complementarity-determining region (CDR) is shown as orange loops on the light chain and yellow loops on the heavy chain. On the right, a ribbon diagram of a CDR is shown with light and heavy chain CDR loops highlighted and labeled (PDB: 1A4J).

