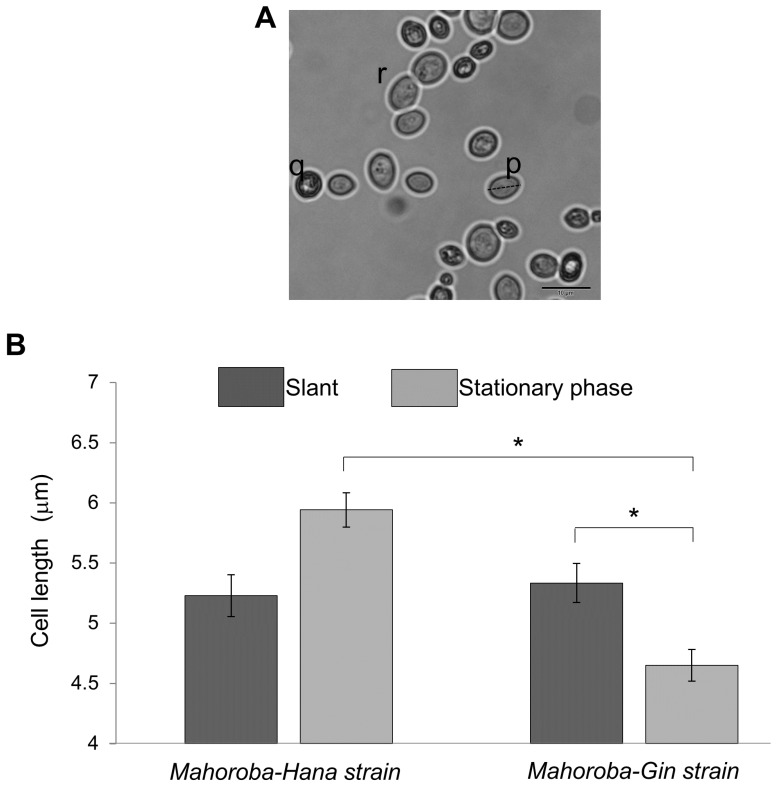
Figure 4.
Sizes of yeast strain cells in two situations. (A) Typical images of yeast. Only alive cells (such as those labeled (p)) are counted. Cells in budding (such as those labeled (r)) were also excluded from the count. (B) Size distributions. Dark gray represents yeast in slant state, and light gray represents yeast in stationary phase. Over 30 cells were counted for the calculation of average size, with standard errors shown as error bars. (* p < 0.05).

