Figure 1.
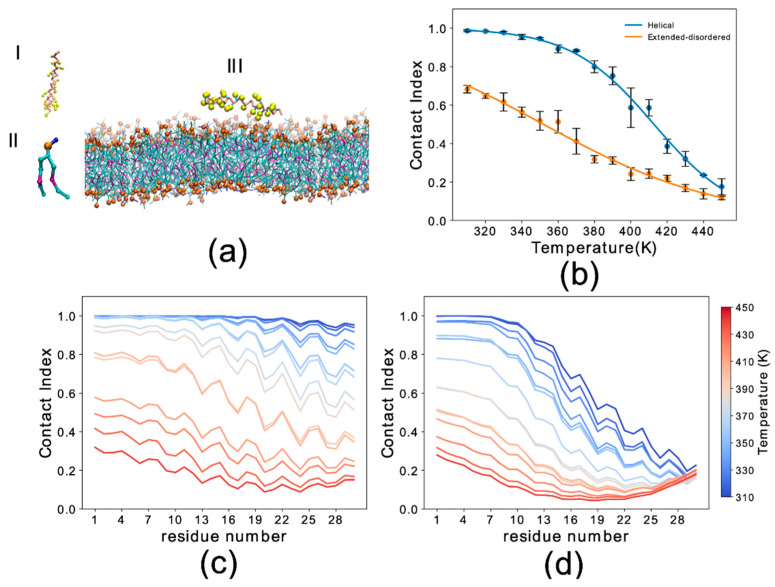
Simulation setup and contact index comparison between the helical and extended-disordered conformations. (a) Representative setup of the simulations. (I) αS1–30 molecule in the Martini 3 force field in helical conformation. Backbone and side chain particles are shown in pink and yellow, respectively. (II) Representative lipid molecule (DOPE). The phosphate group is shown in orange. (III) Lipid bilayer (DOPE, DOPS and DOPC in a 5:3:2 w/w ratio) and an αS1–30 molecule in helical conformation. (b) Membrane-binding melting curves showing the global contact index as a function of the temperature of the simulation. Blue and orange lines report the melting curves of αS1–30 binding to DOPE:DOPS:DOPC lipid bilayer, with the protein in helical and extended-disordered conformations, respectively. Error bars report the standard deviation between three segments of the simulation. (c,d) Residue specific contact indexes in temperatures ranging from 310 K (dark blue) to 450 K (dark red), with a step increment of 10 K. Contact indexes for αS1–30 binding to DOPE:DOPS:DOPC lipid bilayer in helical (c) and extended-disordered (d) conformations.

