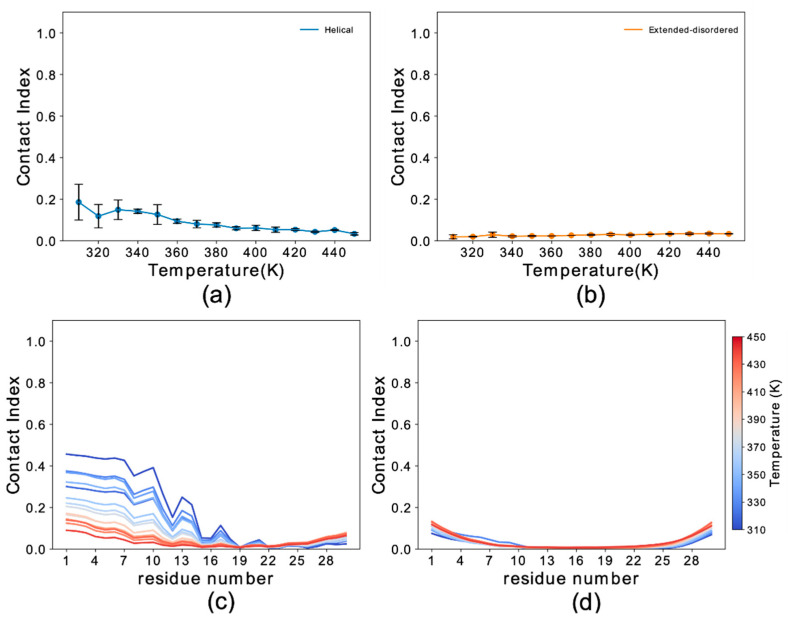
Figure 4.
Binding properties of αS111–140 to DOPE:DOPS:DOPC lipid bilayers. (a,b) Membrane-binding melting curves of αS111–140 calculated from plotting the global contact index as a function of the temperature of the simulation. Helical and extended-disordered conformations are shown in panels (a) and (b), respectively. Error bars report the standard deviation between three segments of the simulations. (c,d) Residue specific contact indexes in the range of temperatures going from 310 K (dark blue) to 450 K (dark red) at step increment of 10 K. Plots for αS111–140 binding to DOPE:DOPS:DOPC lipid bilayer in helical (c) and extended-disordered (d) conformations are shown.

