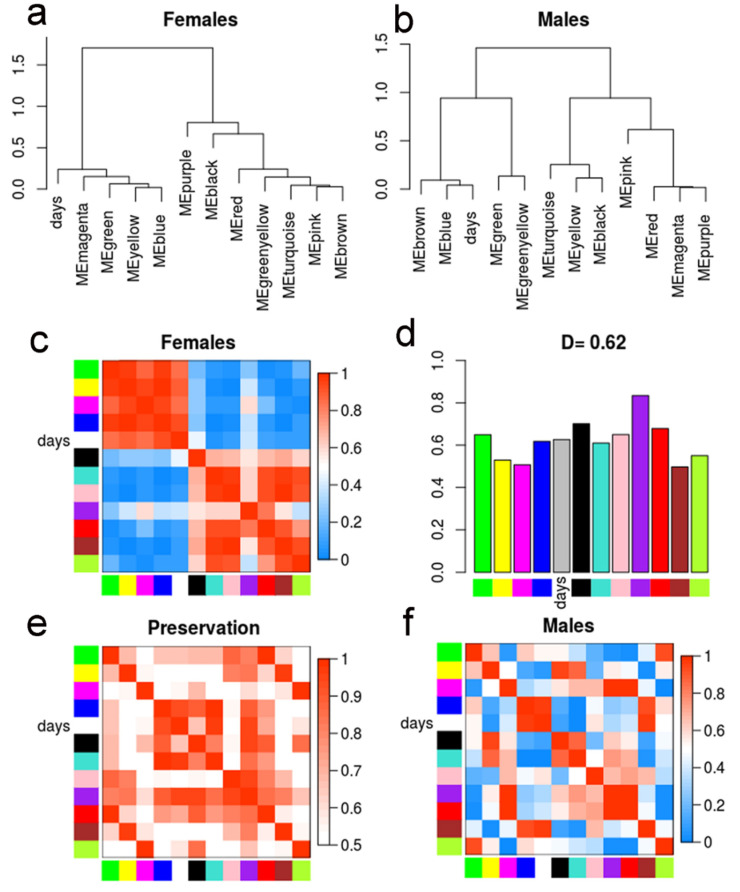
Figure 5.
Differential eigengene network analysis. (a,b) Clustering dendrograms of the consensus module eigengenes for females and males, respectively. (c,f) Females (c) and males (f) heatmaps of eigengene adjacencies (correlation matrix) in the consensus module eigengenes network. Each row and column correspond to one of the eleven module eigengenes (colors). The correlation between the eigengene and the number of days post-infection (days, white) is also indicated. The cells are colored according to the scale at right; red indicates high adjacency (positive correlation) and blue indicates low adjacency (negative correlation). (d) Preservation measure for each consensus eigengene. Each colored bar corresponds to the eigengene of the corresponding module color. The y-axis gives the eigengene preservation measure. The D value denotes the overall preservation of the eigengene networks. (e) Heatmap of adjacencies in the preservation network between females and males. Each row and column correspond to a consensus module; saturation of the red color is proportional to preservation, according to the color legend.

