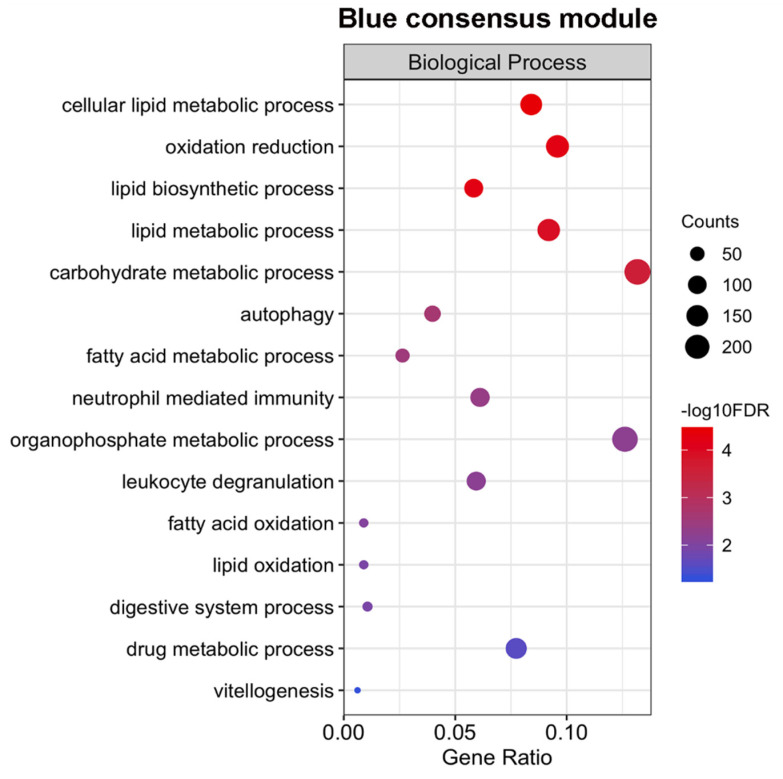
Figure 8.
Selected fifteen Gene Ontology enriched terms for protein-coding the genes of the blue consensus module. Only GO terms from the Biological Process category are represented. The size of the circles is proportional to the number of genes (counts scale on the right) in each significantly enriched GO term, and the colors show the statistical significance of the enrichment, as indicated by the –log10 FDR values (color-coded scale at the right).

