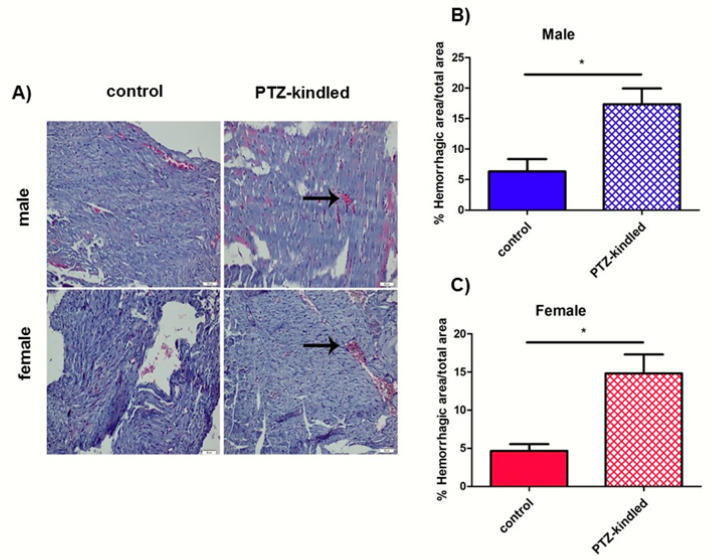
Figure 5.
(A) Representative images of Hematoxylin and Eosin (HE)-stained heart sections from both male and female PTZ-kindled rat rats vs. controls. Hemorrhagic areas are indicated by arrows. Pictures were taken at the magnification of ×200. Scale bar: 50 μm. Bars represent the mean ± SEM of the percentage of the hemorrhagic area in male (B) and female (C) rats, n = 7 for each group, * p < 0.05.

