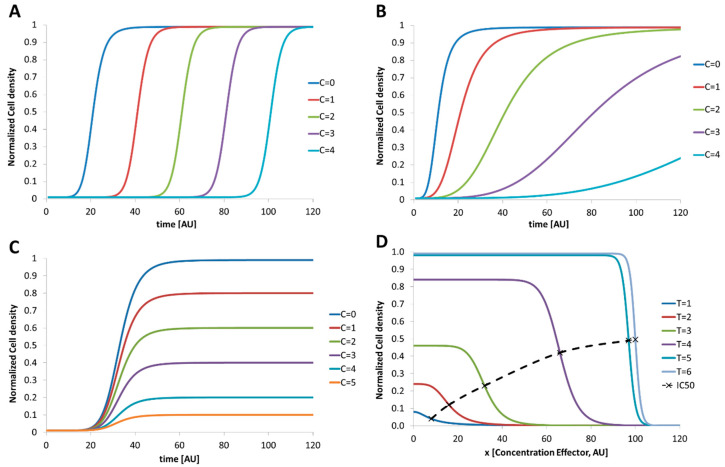
Figure 1.
Schematic graphs indicate the development of the cell density over time in dependence on increasing effector concentrations. Examples for the different response types are: (A) increasing effector concentration prolongs the lag phase, but do not interfere with the other phases. Here, the organism needs some time to adapt to the changed conditions before the number of organisms starts to grow. Hence, the lag phase is proportional to the effector concentration; (B) increasing effector concentration reduces the exponential growth (doubling time). The organism number increase, but the effector reduces the rate of proliferation; (C) increasing effector concentration does not influence the lag—or exponential—phase but limits the maximum cell density in the stationary phase. Here, the number of organisms increases up to a limit proportional to the effector concentration. Depending on the chosen detection sensor for the cell density a change in morphology (organism may form aggregates or shrink as response to the effector) can cause this effect; (D) dose–response plot indicates the development of the cell density over the effector concentration for different times. It represents the data which are gained by experiments to derive the growth kinetics as shown before. Characteristic point is the inhibitory concentration which indicates the effector concentration that inhibits the growth by 50% of the maximum cell density without effector (IC50-Value). Dashed line indicates the temporal development of the IC50 values which would be determined at the different points in time.

