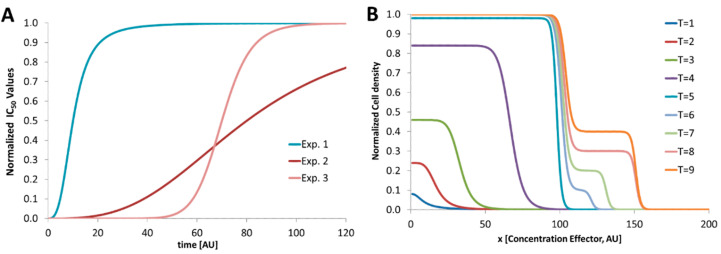
Figure 2.
Schematic graphs. (A) Schematic development of IC50 values with respect to the varying response behavior to different experimental conditions such as different organisms, effectors or broth media; (B) nonlinear behavior of an organism which responds to the effector differently. After prolonged incubation (T > 5) a second growth phase takes place at higher effector concentrations (>100) and moves the IC50 value from about 100 to about 150 (AU).

