Figure 11.
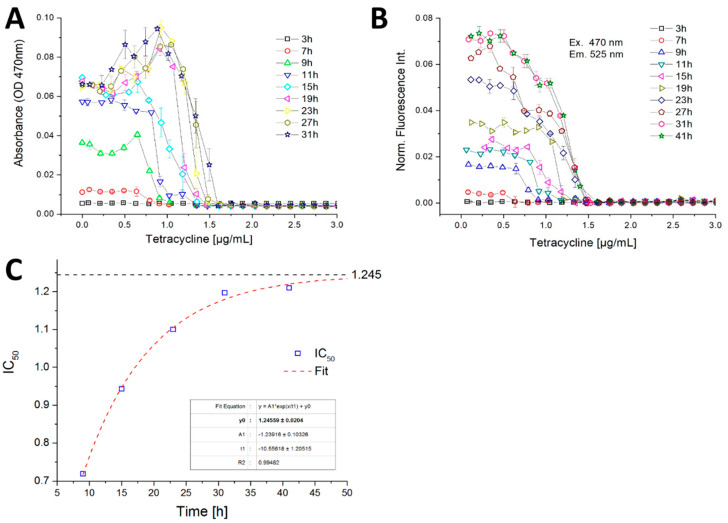
Dose–response curves with high concentration- and temporal-resolution based on the (A) optical density and (B) autofluorescence intensity of B. megaterium against tetracycline obtained in micro-fluid segment sequences with continuously varied effector concentrations; (C) IC50 value development during the incubation time from 7 to 41 h. Asymptotic fit reveals an IC50 value of about 1.245 µg/mL.

