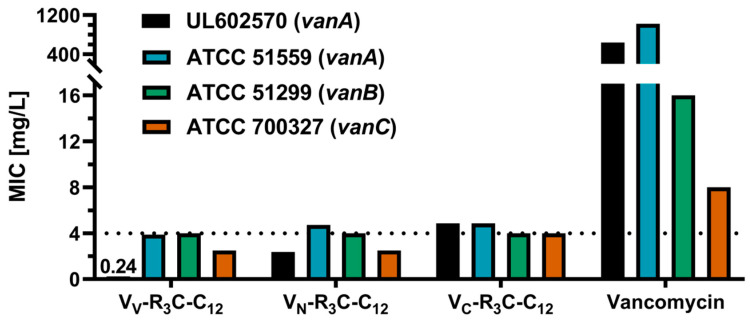
Figure 3.
Comparison of MIC values for vanA, vanB, and vanC resistant enterococci. The tested conjugates were modified with the same lipopeptide, but coupled on varying modification sites. The different MIC values demonstrate the influence of the modification position. The dotted line denotes the enterococci resistance breakpoint of 4 mg/L. Data are shown as the median of a minimum of three independent experiments tested at least in duplicate. A tabular overview is shown in the supplementary information, Table S2.

