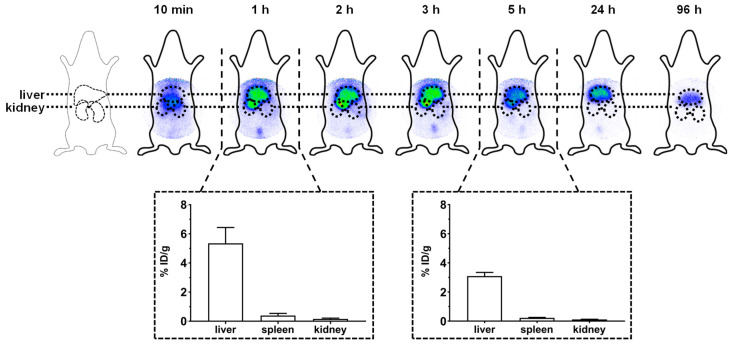
Figure 5.
Scintigraphic imaging and biodistribution studies of VV-R3yC-C12. After an intravenous injection of the labeled conjugate, images were taken at several time points (10 min, 1 h, 2 h, 3 h, 5 h, 24 h, and 96 h) post injection. In an additional experiment, further Wistar rats were injected intravenously with the radiolabeled compound and euthanized after 1 and 5 h. Subsequently, the organs were removed to determine the percentage of the injected dosage per gram organ (% ID/g). Data is shown within the dotted squares (n = 3).

