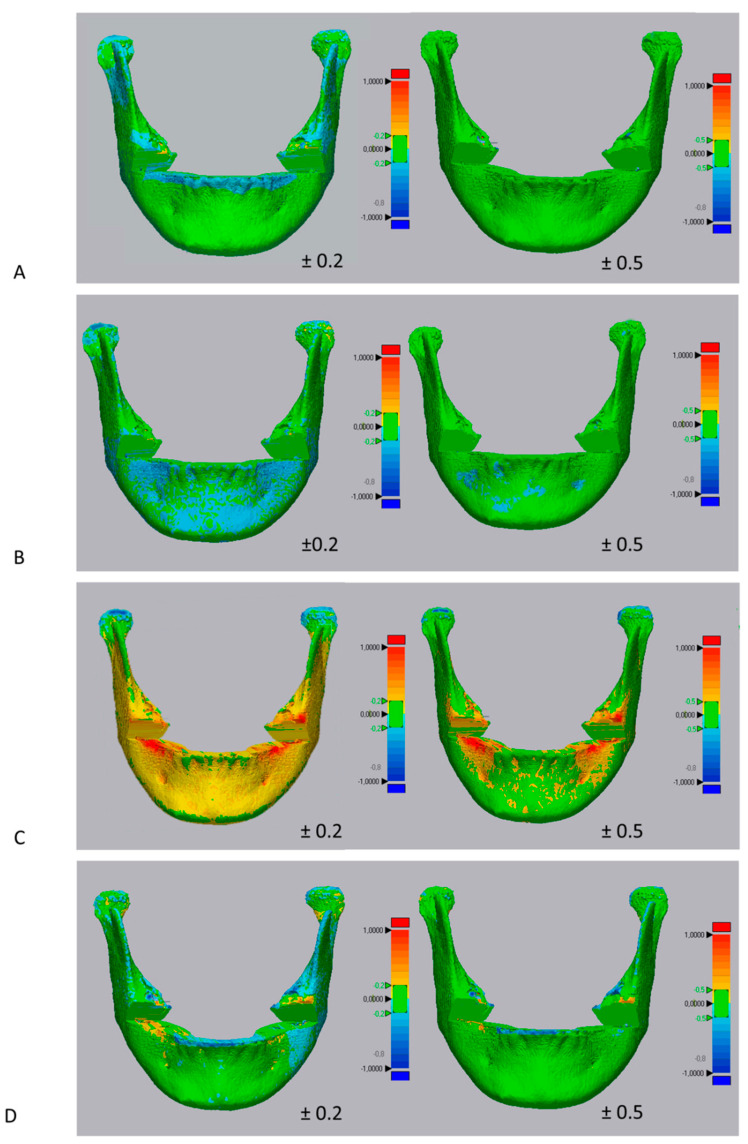
Figure 4.
Surface-based deviation analysis between 3D mandibular models obtained with semi-automatic segmentation and its ground truth model (manual segmentation). (A) ITK-Snap; (B) Invesalius; (C) Dolphin 3D; (D) Slicer 3D. The green of the color scale bar, on the right, represents the range of tolerance. Left side—color map set to a range of tolerance of ±0.2 mm. Right side—color map set to a range of tolerance of ±0.5 mm.

