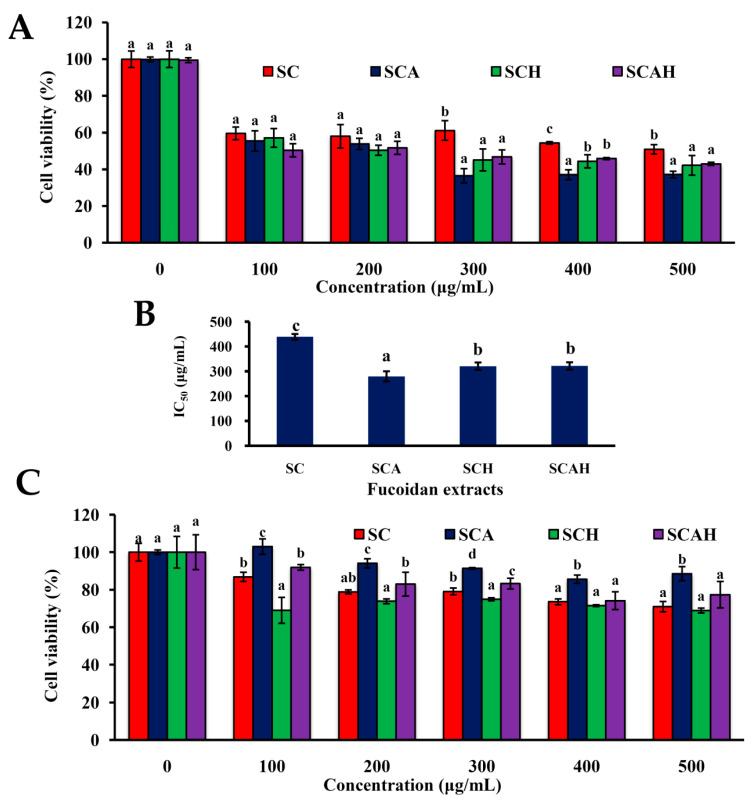
Figure 2.
Effects of SC, SCA, SCH, and SCAH on cell viabilities of A-549 and BEAS-2B cells: (A) A-549 cells were co-incubated with various concentrations of SC, SCA, SCH, and SCAH for 48 h, and cell viability was assessed. Bars in the same treating concentration bearing different letters (in a, b, and c) significantly differ at the level of 0.05; (B) bar graphs show the half maximal inhibitory concentration (IC50) values (the inhibitory concentrations at 50% growth of A-549 cells) of SC, SCA, SCH, and SCAH as determined for (A). Bars bearing different letters (in a, b, and c) significantly differ at the level of 0.05; (C) BEAS-2B cells were co-incubated with various concentrations of SC, SCA, SCH, and SCAH for 48 h, and the cell survival was evaluated. Bars in the same treating concentration bearing different letters (in a, b, c, and d) significantly differ at the level of 0.05. Experiments were repeated three times.

