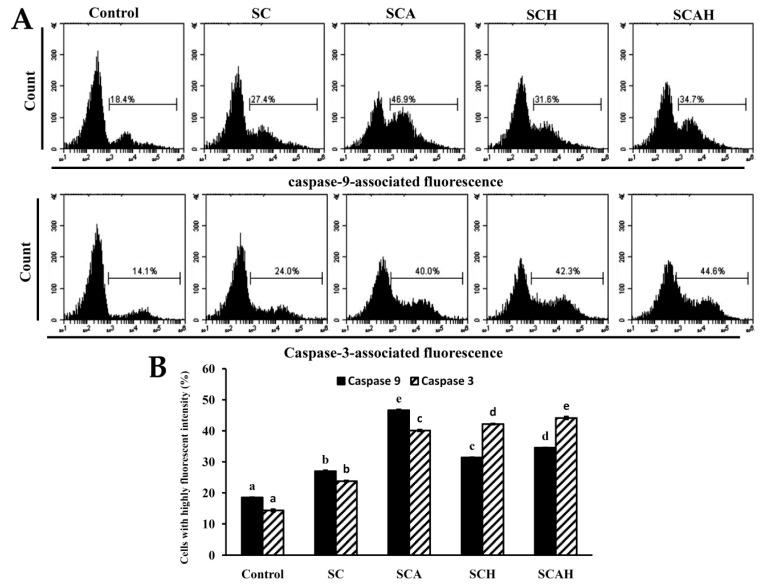
Figure 6.
Effects of SC, SCA, SCH, and SCAH treatments on the activation of caspase-9 and -3 in A-549 cells. A-549 cells were treated without and with 200 μg/mL SC, SCA, SCH, and SCAH for 48 h, and the flow-cytometric profiles of immunolabeled caspase-9 and -3 were determined: (A) histograms; (B) bar chart. Bars in the same caspase-9 or caspase-3 group bearing different letters (in a, b, c, d, and e) significantly differ at the level of 0.05. Experiments were repeated three times.

