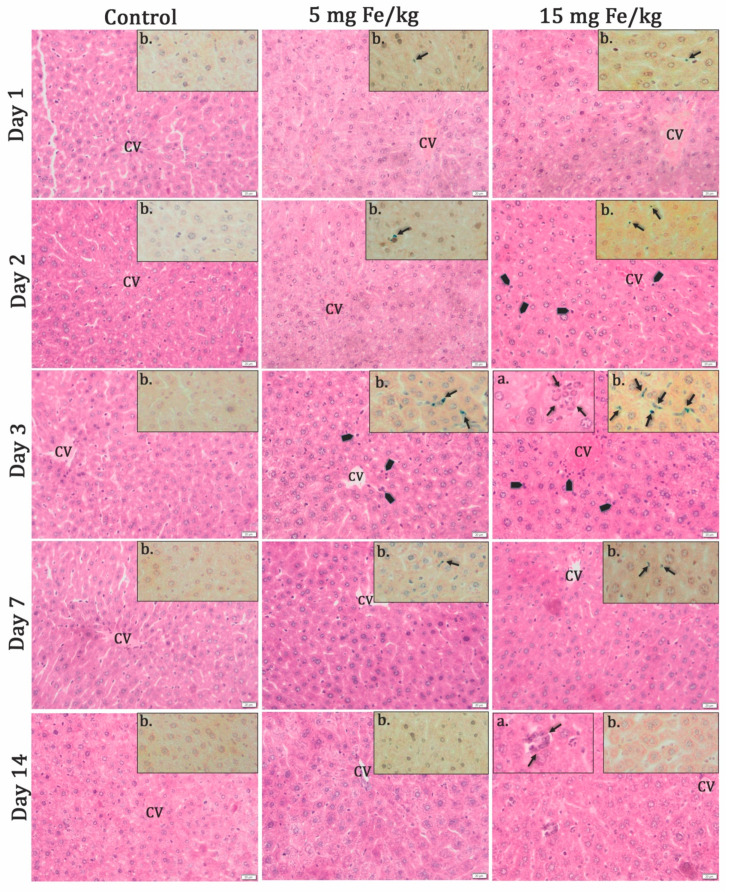
Figure 2.
The histopathological aspect of the liver tissues at 1, 2, 3, and 7 d of MNP-DSPE-PEG injection. Hematoxilin&Eosin staining; CV—centrilobular vein; arrowhead—inflammatory cells; (a) detail rectangles—granulomas with giant cells; (b) detail rectangles—Prussian blue staining of the presence of iron deposits (blue color indicated by arrows) in the pathological tissue slides after 1, 2, 3, and 7 d post-MNP injection. Scale bar: 20 μm.

