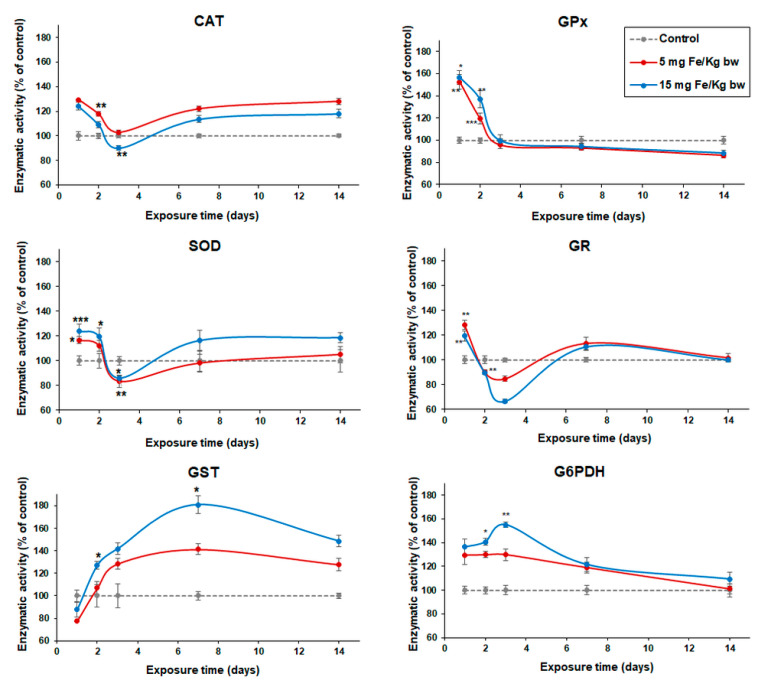
Figure 6.
Variation of enzymatic activity of CAT, SOD, GPx, GR, GST, and G6PDH in the liver of CD1 mice treated with 5 and 15 mg Fe/kg bw of MNP-DSPE-PEG after 1, 2, 3, 7, and 14 d from the administration. Values are represented as mean ± standard deviation (SD) and are expressed as a percentage of control; the results were considered statistically significant when * p < 0.05; ** p < 0.01; *** p < 0.001 versus the control group.

