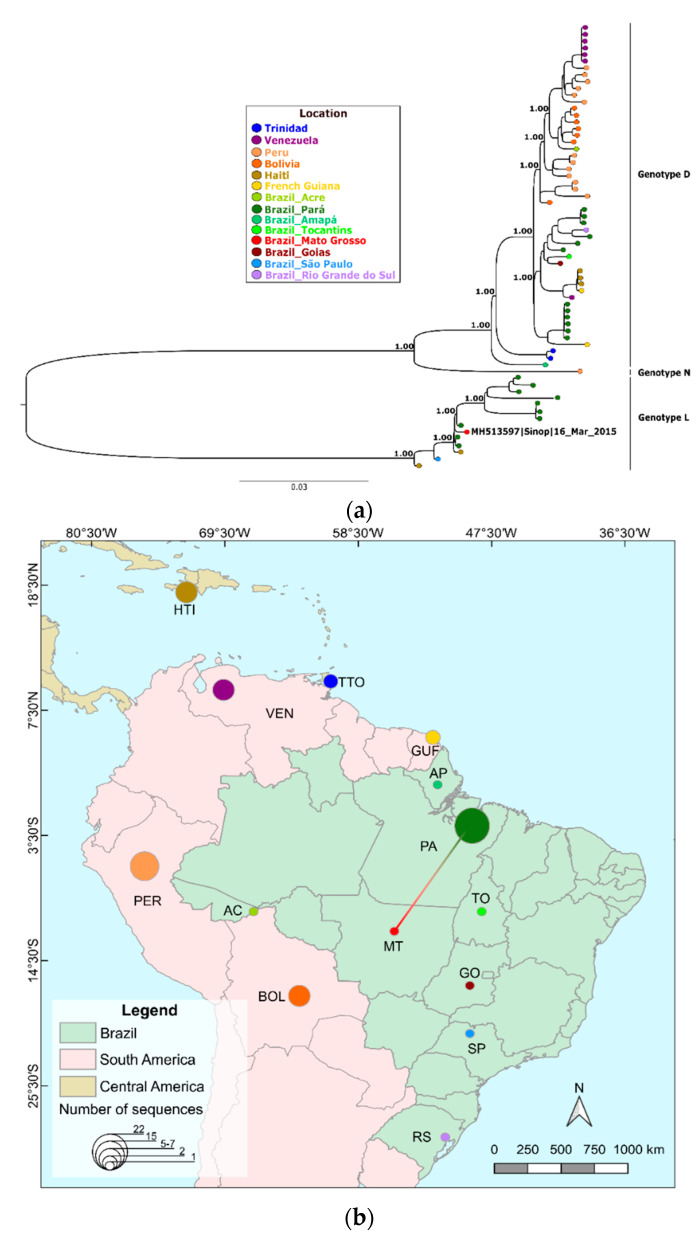
Figure 2.
Full phylogenetic reconstruction of MAYV. (a) Phylogeny including all available MAYV genomes and positioning of MAYV genome obtained in this study using maximum likelihood of complete and draft genomes (>8 kb) available. (b) Distribution of the number of MAYV genomes sequenced per country and Brazilian state and colored edges showing a possible route of MAYV spread based on the most closely related MAYV genome from the phylogenetic analysis shown in panel A. Country and Brazilian state colors follow tip colors in panel A.

