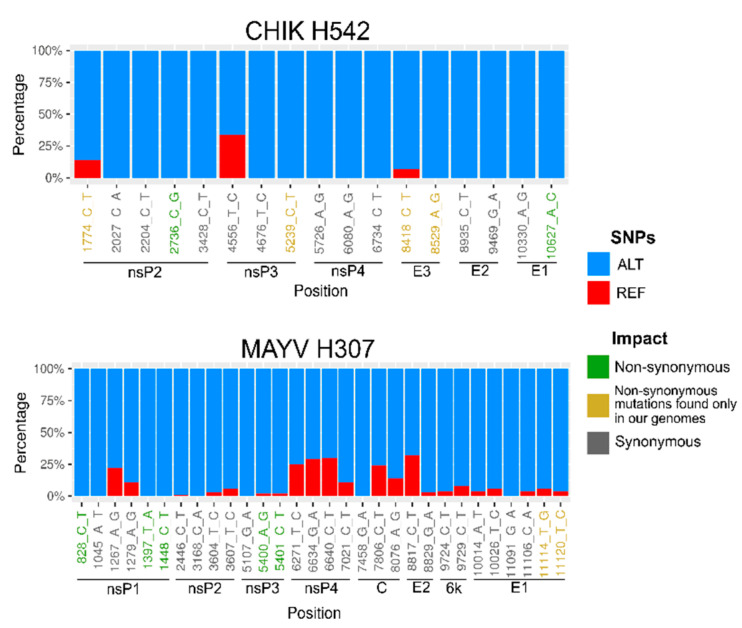
Figure 4.
Single nucleotide polymorphism (SNP) analysis. Proportion of sequencing reads supporting the reference nucleotide (REF—red) and the SNPs (ALT—blue) from the CHIKV and MAYV genomes obtained in this study. Green, yellow and gray position names below each bar plot denote non-synonymous, non-synonymous mutations found only in our genomes and synonymous SNPs.

